







USDJPY, Nasdaq Analysis: Bull Trends in Question
USDJPY, Nasdaq Analysis: Both Nasdaq and USDJPY are clinging to the supporting trendlines of their primary uptrends, raising questions about the continuation of strong bullish trends or the possibility of steep bearish corrections. What's next with the upcoming earnings and BOJ meeting?
Share this:

Article Outline
- Week Ahead: Trump Returns, Earnings, BOJ Decision, and Flash PMIs
- Technical Analysis: USDJPY and Nasdaq (3-Day Time Frames)
- Technical Analysis (TA) Tips: Wicks
Trump Returns
Donald Trump is set to take office on Monday, January 20th, while U.S. markets will be closed for a holiday. With promises of implementing drastic policies from day one, irregular volatility risks are a key concern. These policies are expected to impact global economies gradually, but unexpected developments could introduce significant risk factors.
Earnings
Positive earnings reports from U.S. banks and Taiwan Semiconductor this week have boosted momentum in U.S. indices. Next week’s earnings-related volatility may center on Netflix’s results, scheduled for Wednesday. The Nasdaq remains in an upward trajectory, holding above the 21,000-mark despite sharp downside wicks on the chart.
Ahead of major tech earnings in the final week of January, several events are likely to influence volatility:
- PBOC monetary policies (Monday)
- Netflix earnings (Wednesday)
- Manufacturing and Services PMIs (Friday)
- World Economic Forum (throughout the week)
PBOC and BOJ Decisions
China’s economy continues to exceed expectations, with stimulus-driven loan prime rates under the spotlight. These measures could amplify global economic trends, though Trump’s tough policies may challenge this momentum. Meanwhile, the Japanese Yen remains in a critical state, with intervention risks looming. Market expectations lean toward a 25 bps rate hike from the BOJ, adding pressure to the USDJPY pair.
Technical Analysis: Quantifying Uncertainties
USDJPY Analysis: 3 Day Time Frame – Log Scale
Source: Tradingview
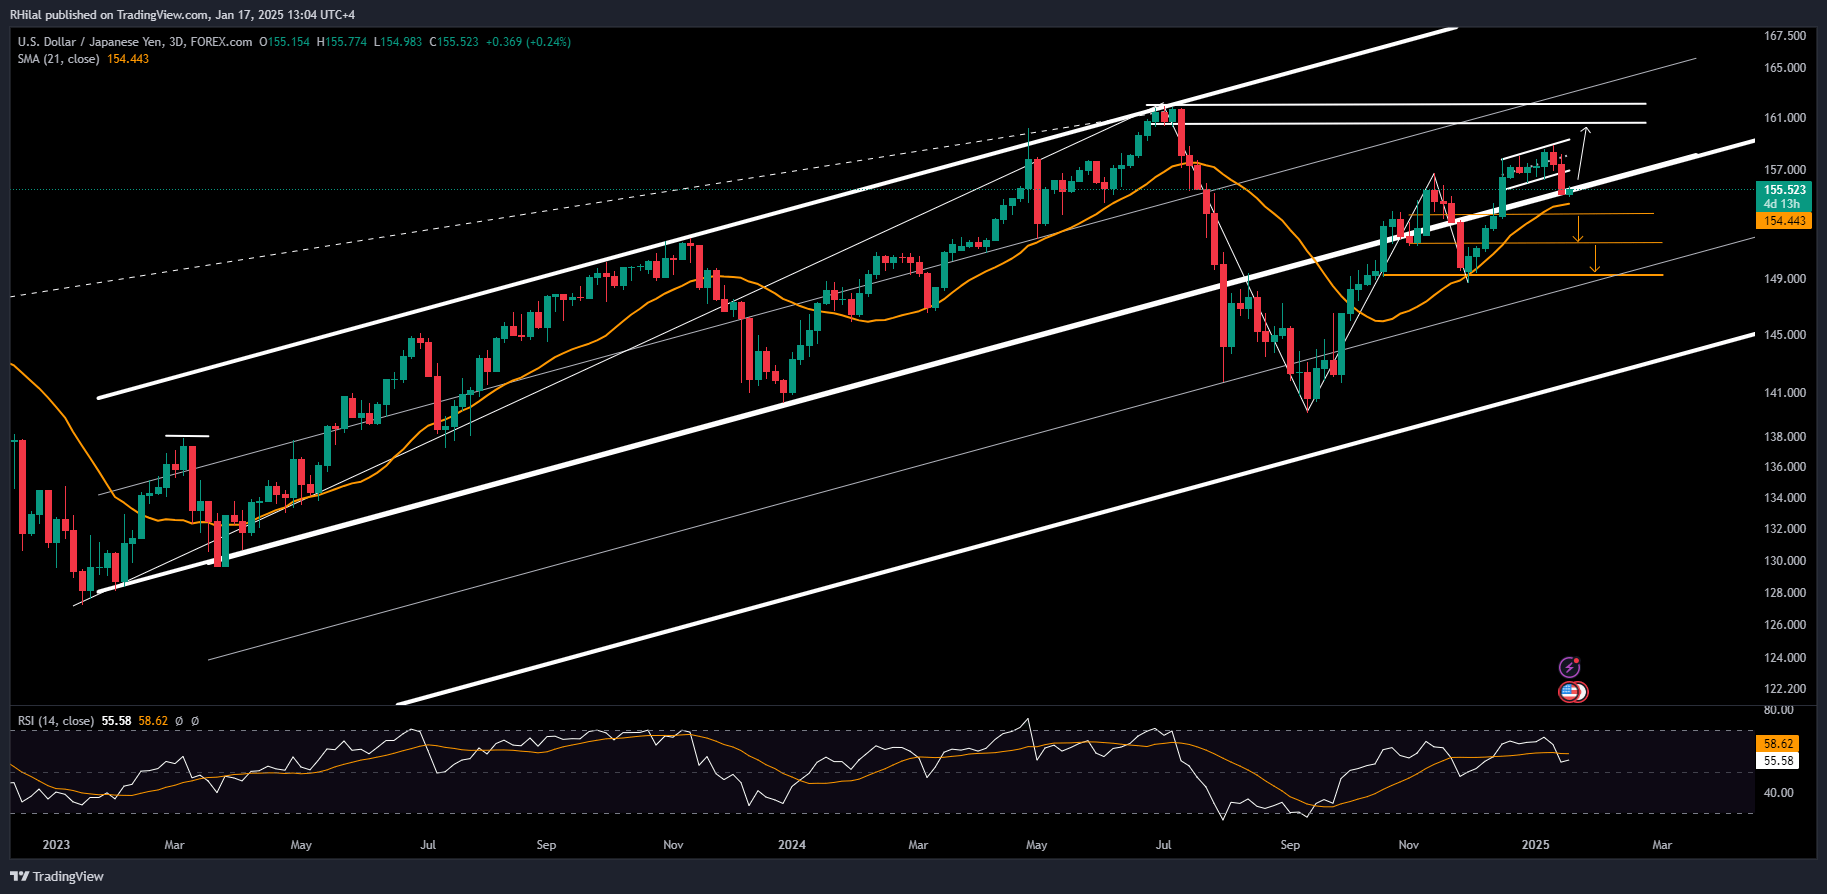
The USDJPY pair is holding onto the lower border of its primary up-trending channel, which has been intact since January 2023 and extends to August 2024. The current border, supported by the 21-period simple moving average at 153.60, is preventing further declines.
Key Levels to Watch:
- Downside: A firm close below 153.60 could extend bearish drops toward 151.60 and 149.00.
- Upside: Holding above 154.00 may propel the pair toward 159.00, 160.00, and 162.00, where heightened volatility and BOJ intervention risks are likely.
Nasdaq Analysis: 3 Day Time Frame – Log Scale
Source: Tradingview
The Nasdaq is holding the borders of its primary uptrending channel, established from the 2022 lows, and remains above the critical 20,700-mark. This week, the trend extended wicks down to 20,530, before rebounding above 21,000, reinforcing bullish strength.
The consolidation pattern observed between December 2024 and January 2025 offers potential for measurable breakouts, supported by Fibonacci retracement ratios in the breakout direction.
Key Levels to Watch:
- Downside: A breakout below 20,700 could extend declines toward 20,200, 20,000, and 19,600, aligning with the 0.618 Fibonacci retracement level of the uptrend from August 2024 (17,230) to December 2024 (22,133).
- Upside: Respecting the channel borders and the critical 20,700 support could extend the uptrend toward 21,700, 22,100, and 22,800.
Technical Analysis (TA) Tip: Wicks
Source: Tradingview
Wicks, or shadows, on a candlestick chart represent sharp price movements that deviate from the mean before reverting. Extended wicks on the lower side indicate an inability to sustain lows, signaling a potential upward bias (bullish). Conversely, extended wicks on the upper side reflect an inability to sustain highs, amplifying a potential downward bias (bearish). These patterns can provide key insights into market sentiment and price dynamics.
Written by Razan Hilal, CMT
Follow on X: @Rh_waves
On YouTube: Forex.com
Latest market news




Open an account in minutes
Experience award-winning platforms with fast and secure execution, and enjoy tight spreads from 0.5 pts on FX and 0.3 pts on indices.
Economic calendar
Web Trader platform
Our sophisticated web-based platform is packed with features.
Related articles
USD/JPY Q4 2026 Outlook: Hawkish Fed Pricing Clashes With Intervention Risk
The year-end tug-of-war is clear: hawkish Fed pricing supports USD/JPY, while intervention risk limits the upside.

Japanese Yen Forecast: USD/JPY 4% Rally Challenges Post-Intervention Downtrend 9 24 2026
USD/JPY momentum has shifted sharply higher, putting a major resistance confluence in focus as U.S. and Japanese event risk builds.


Oil, USD/JPY Forecast: Two trades to watch
Oil recovers above $90 amid a lack of progress in US-Iran diplomacy. USD/JPY rises to 158 on widening Fed-BoJ policy outlook.

This report is intended for general circulation only. It should not be construed as a recommendation, or an offer (or solicitation of an offer) to buy or sell any financial products. The information provided does not take into account your specific investment objectives, financial situation or particular needs. Before you act on any recommendation that may be contained in this report, independent advice ought to be sought from a financial adviser regarding the suitability of the investment product, taking into account your specific investment objectives, financial situation or particular needs.
StoneX Financial Pte. Ltd., may distribute reports produced by its respective foreign entities or affiliates within the StoneX group of companies or third parties pursuant to an arrangement under Regulation 32C of the Financial Advisers Regulations. Where the report is distributed to a person in Singapore who is not an accredited investor, expert investor or an institutional investor (as defined in the Securities Futures Act), StoneX Financial Pte. Ltd. accepts legal responsibility to such persons for the contents of the report only to the extent required by law. Singapore recipients should contact StoneX Financial Pte. Ltd. at 6826 9988 for matters arising from, or in connection with the report.
In the case of all other recipients of this report, to the extent permitted by applicable laws and regulations neither StoneX Financial Pte. Ltd. nor its associated companies will be responsible or liable for any loss or damage incurred arising out of, or in connection with, any use of the information contained in this report and all such liability is hereby expressly disclaimed. No representation or warranty is made, express or implied, that the content of this report is complete or accurate.
StoneX Financial Pte. Ltd. is not under any obligation to update this report.
Trading CFDs carries a high level of risk that may not be suitable for some investors. Consider your investment objectives, level of experience, financial resources, risk appetite and other relevant circumstances carefully. The possibility exists that you could lose some or all of your investments, including your initial deposits. If in doubt, please seek independent expert advice. Visit www.forex.com/en-sg/terms-and-policies for the complete Risk Disclosure Statement.