



WTI Crude Futures Downside Correction
WTI Crude Futures have dropped about 8% so far in September with increased volatility compared with the last two months...
Share this:

WTI Crude Futures (November contract) have dropped about 8% so far in September with increased volatility compared with the last two months. Optimism on a speedy recovery in the global economy has eased, while weakness in the stock markets and a rebound in U.S. dollar have also put pressure on the oil prices.
Meanwhile, the American Petroleum Institute (API) reported that U.S. crude-oil inventories rose 691,000 barrels in the week ending September 18 (-2.26 million barrels expected). Later today, the U.S. Energy Information Administration (EIA) will release official crude oil inventories data for the same period.
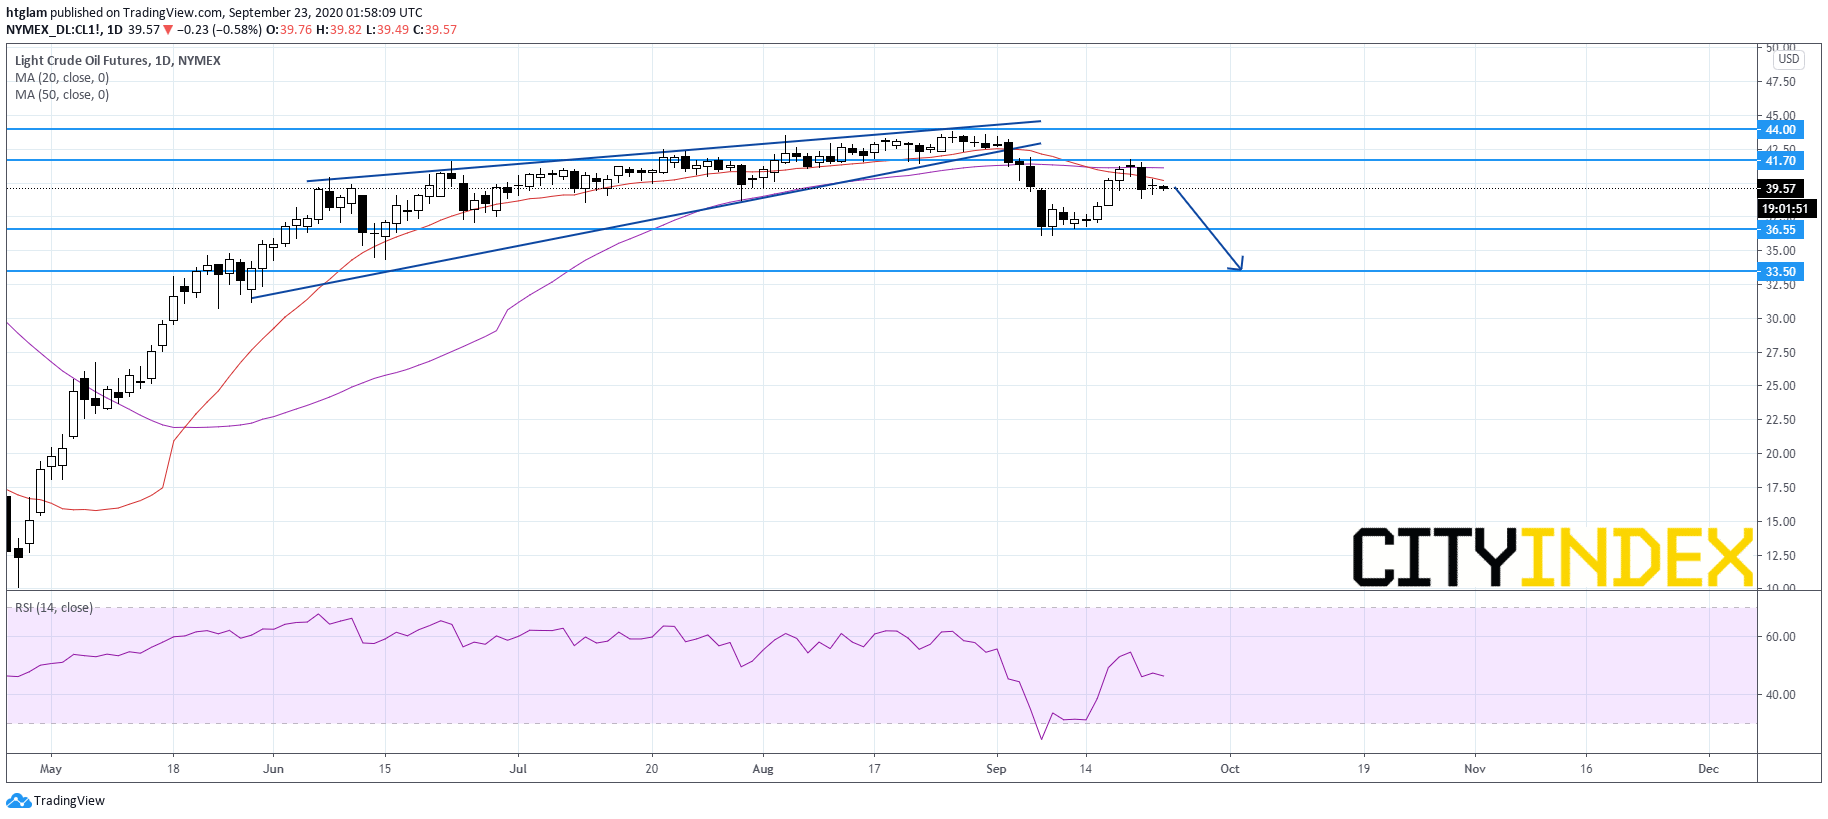
From a technical point of view, WTI Crude Futures (November contract) flags downside risks as shown on the daily chart. It has broken below a bearish rising wedge pattern, while the 20-day moving average has crossed below the 50-day one. The level at $41.70 may be considered as the nearest resistance, while the 1st and 2nd support are expected to be located at $36.55 and $33.50.
Source: Gain Capital, TradingView
WTI Crude Futures (November contract) have dropped about 8% so far in September with increased volatility compared with the last two months. Optimism on a speedy recovery in the global economy has eased, while weakness in the stock markets and a rebound in U.S. dollar have also put pressure on the oil prices.
Meanwhile, the American Petroleum Institute (API) reported that U.S. crude-oil inventories rose 691,000 barrels in the week ending September 18 (-2.26 million barrels expected). Later today, the U.S. Energy Information Administration (EIA) will release official crude oil inventories data for the same period.
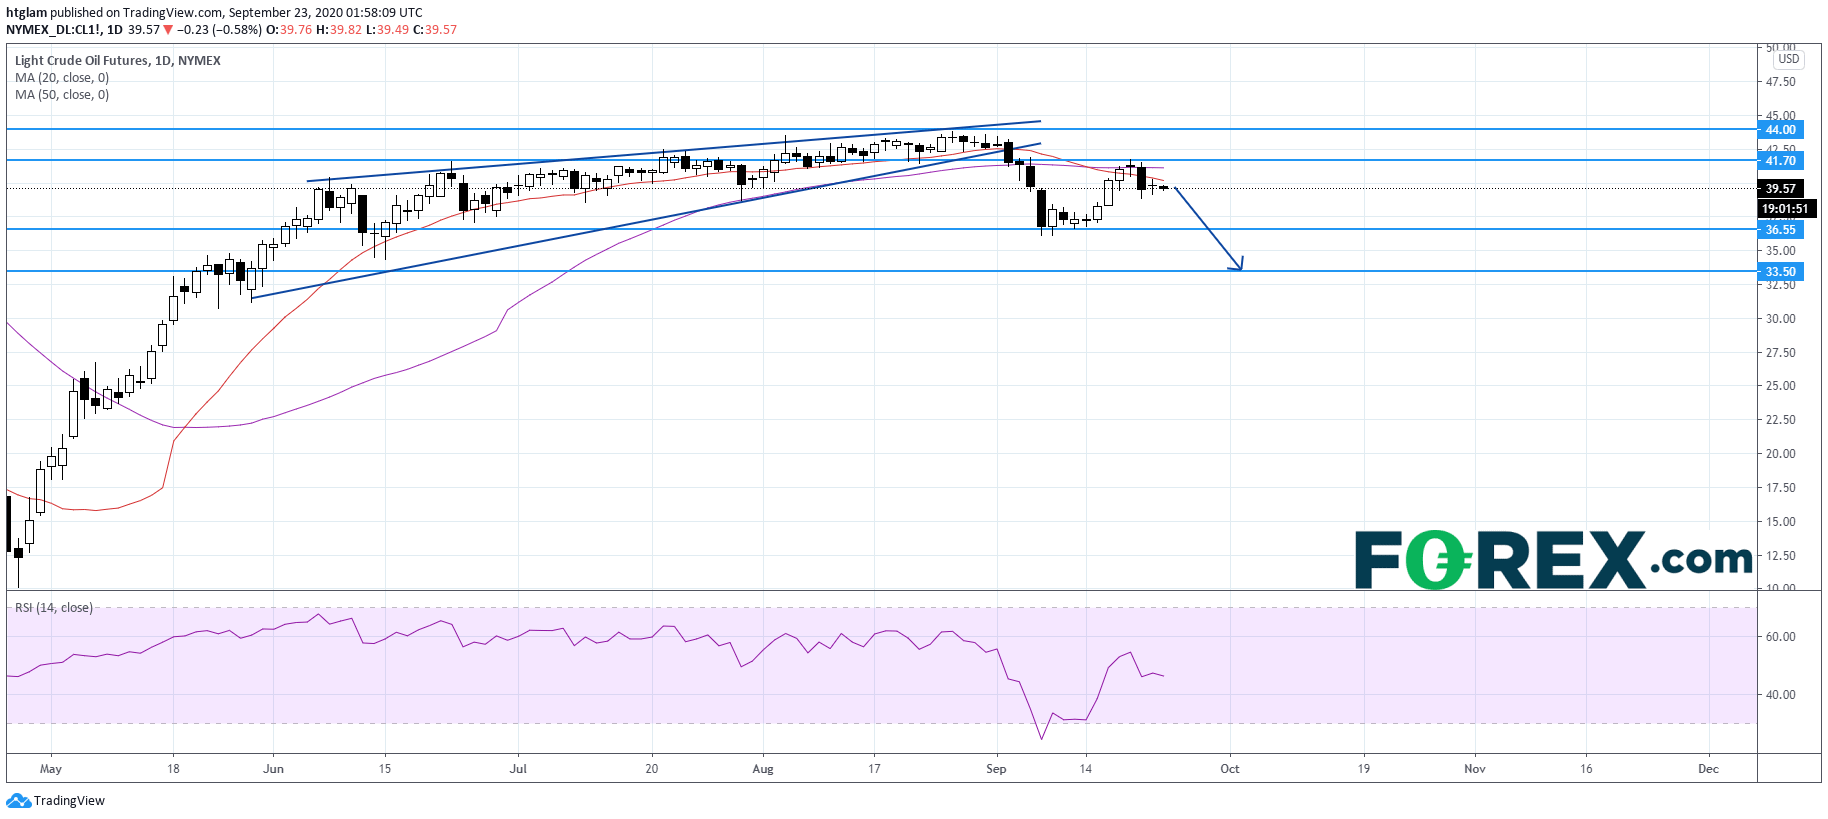
From a technical point of view, WTI Crude Futures (November contract) flags downside risks as shown on the daily chart. It has broken below a bearish rising wedge pattern, while the 20-day moving average has crossed below the 50-day one. The level at $41.70 may be considered as the nearest resistance, while the 1st and 2nd support are expected to be located at $36.55 and $33.50.
Source: Gain Capital, TradingView
Related tags:



Open an account in minutes
Experience award-winning platforms with fast and secure execution, and enjoy tight spreads from 0.5 pts on FX and 0.3 pts on indices.
Economic calendar
Web Trader platform
Our sophisticated web-based platform is packed with features.
Related articles

Oil Quietly Hands the Fed a Reason to Stay Hawkish
Oil prices and the U.S. dollar are both on the front foot as elevated energy costs feed Fed warnings that inflation may prove sticky.


Wall Street Forecast: DJIA falls as treasury yields hit new highs and ahead of the Trump-Xi summit
U.S. stocks are falling, further extending losses from the previous session, as oil prices move higher alongside Treasury yields and caution reigns ahead of the summit between President Trump and Xi Jinping.


Oil, USD/JPY Forecast: Two trades to watch
Oil recovers above $90 amid a lack of progress in US-Iran diplomacy. USD/JPY rises to 158 on widening Fed-BoJ policy outlook.
This report is intended for general circulation only. It should not be construed as a recommendation, or an offer (or solicitation of an offer) to buy or sell any financial products. The information provided does not take into account your specific investment objectives, financial situation or particular needs. Before you act on any recommendation that may be contained in this report, independent advice ought to be sought from a financial adviser regarding the suitability of the investment product, taking into account your specific investment objectives, financial situation or particular needs.
StoneX Financial Pte. Ltd., may distribute reports produced by its respective foreign entities or affiliates within the StoneX group of companies or third parties pursuant to an arrangement under Regulation 32C of the Financial Advisers Regulations. Where the report is distributed to a person in Singapore who is not an accredited investor, expert investor or an institutional investor (as defined in the Securities Futures Act), StoneX Financial Pte. Ltd. accepts legal responsibility to such persons for the contents of the report only to the extent required by law. Singapore recipients should contact StoneX Financial Pte. Ltd. at 6826 9988 for matters arising from, or in connection with the report.
In the case of all other recipients of this report, to the extent permitted by applicable laws and regulations neither StoneX Financial Pte. Ltd. nor its associated companies will be responsible or liable for any loss or damage incurred arising out of, or in connection with, any use of the information contained in this report and all such liability is hereby expressly disclaimed. No representation or warranty is made, express or implied, that the content of this report is complete or accurate.
StoneX Financial Pte. Ltd. is not under any obligation to update this report.
Trading CFDs carries a high level of risk that may not be suitable for some investors. Consider your investment objectives, level of experience, financial resources, risk appetite and other relevant circumstances carefully. The possibility exists that you could lose some or all of your investments, including your initial deposits. If in doubt, please seek independent expert advice. Visit www.forex.com/en-sg/terms-and-policies for the complete Risk Disclosure Statement.