
Key Events
- Beyond tariff uncertainty, crypto markets are watching upcoming US regulatory approvals closely, as clearer compliance standards could strengthen institutional confidence in the industry.
- Bitcoin is fluctuating near the lower end of the 60,000 range, as risk-off sentiment continues to dominate US tech stocks and support defensive sectors
- The Fed rate hold sentiment, sustaining dollar strength, is also keeping consolidation risks alive on the crypto chart near the lower end of the 60,000 range
I covered the key patterns and levels on the Bitcoin chart in yesterday’s biweekly webinar, along with major market assets, amid capped market appetite.
Dip-buying interest is emerging near the 60,000 zone. However, bears continue to hold downside dominance, in line with broader market uncertainty over tariffs, rates, and tech sector valuations, which are diversifying investor interest away from the US and toward the EU and Asia.
Long-term key levels remain in focus to maintain discipline amid the market’s shifting narratives, helping to distinguish structural trends from short-term volatility.
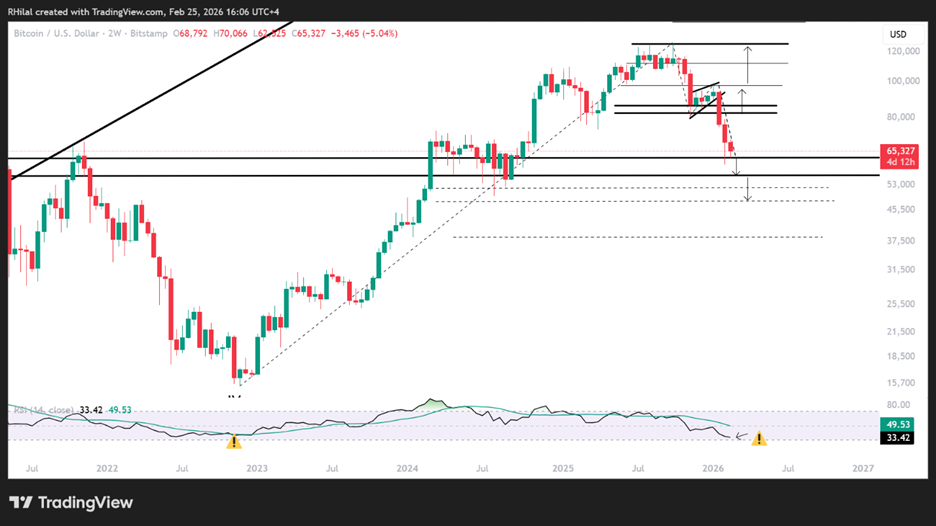
Bitcoin Outlook – 2 Week Time Frame – Log Scale
Source: Trading view
From a two-week perspective, which filters out the noise of the weekly chart, the corrective cycle from the October 2025 highs near 126,000 appears to be stabilizing after reaching several technical milestones:
• The full projected target of the bearish wedge formation that developed between November 2024 and January 2026.
• Oversold RSI levels comparable to those seen in 2022, when Bitcoin traded near 15,000.
• Extended downside wicks reflecting rejection of sustained trade below the key 60,000 level.
This technical alignment improves the case for a bullish reversal. However, with sentiment still fragile, a decisive break below 60,000 could trigger one final drawdown toward the 50,000–48,000 zone, an area likely to attract strategic dip-buying interest.
On the upside, a sustained close above 75,000 followed by a reclaim of 80,000 would reassert bullish bias, exposing 100,000 and 110,000 before confirming the potential for another record rally toward 150,000 and possibly 200,000.
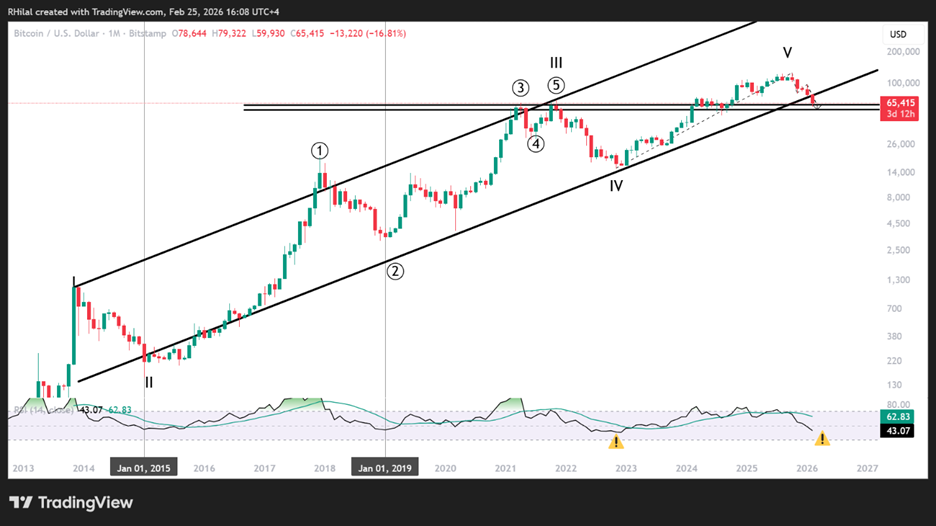
Bitcoin Outlook – Monthly Time Frame – Log Scale
Source: Trading view
From a monthly and logarithmic perspective, Bitcoin’s price action is testing a potential bearish break below the bounds of the long-respected uptrend that has been in place since 2015. A sustained move below this structure would amplify downside pressure, particularly while price remains capped below the 80,000 threshold. A break below the 50,000 threshold, aligned with the previous resistance of 2021, exposes deeper downside potential towards the 38,000 mark.
However, this same structure also reinforces the integrity of the long-term bull trend. A recovery back above 80,000, followed by a sustained move beyond 100,000, would reassert the broader bullish cycle and confirm that the current weakness remains corrective rather than structural.
Written by Razan Hilal, CMT
Follow on X: @Rh_waves