
Weekly Technical Trade Levels on USD Majors, Commodities & Stocks
- USD technical trade setups we are tracking this week post-Fed
- Next Weekly Strategy Webinar: Monday, December 22 at 8:30am ET
- Review the latest Video Updates or Stream Live on my YouTube playlist
In this webinar we take an in-depth look at the technical trade levels for the US Dollar (DXY), Euro (EUR/USD), British Pound (GBP/USD), Australian Dollar (AUD/USD), Canadian Dollar (USD/CAD), Japanese Yen (USD/JPY), Swiss Franc (USD/CHF), Gold (XAU/USD), Silver (XAG/USD), Crude Oil (WTI), S&P 500 (SPX500), Nasdaq (NDX), and Dow Jones (DJI), and Bitcoin (BTC/USD). These are the levels that matter on the technical charts into the weekly open.
Gold Price Chart – XAU/USD Daily
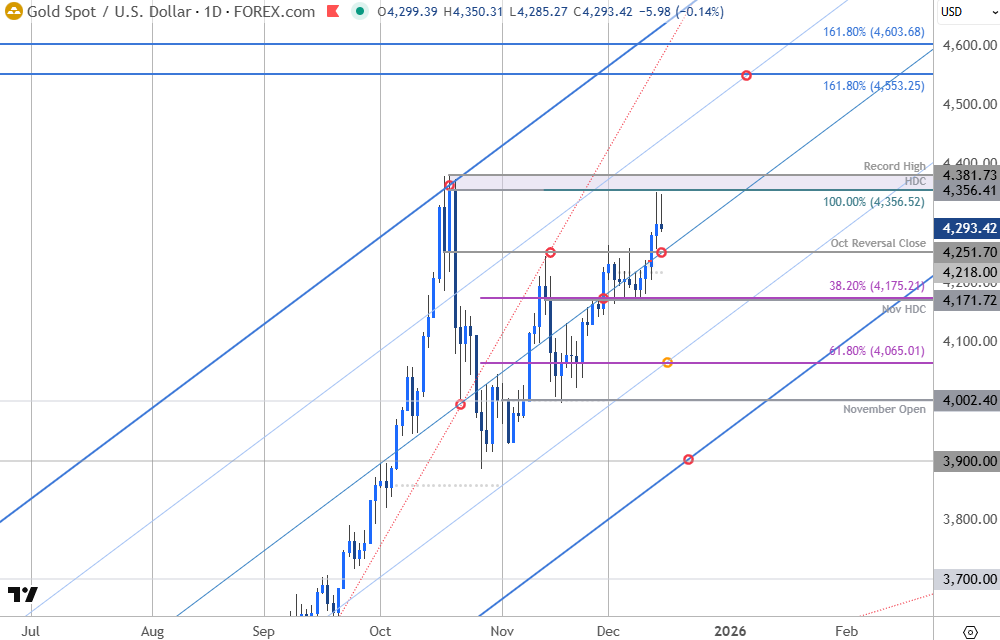
Chart Prepared by Michael Boutros, Sr. Technical Strategist; XAU/USD on TradingView
Notes: Gold prices broke out of a tight monthly opening-range last week with the rally exhausting just ahead of key weekly resistance at 4356/81- a region defined by the record high-day close (HDC), the 100% extension of the late-October advance, and the all-time high. Looking for a reaction off this pivot-zone.
Initial support rests with the October-reversal close at 4252- note that the median-line converges on this threshold this week. Subsequent support rests with the December low at 4218. Near-term bullish invalidation is now raised to the November high-day close / 38.2% retracement of the late-October rally at 4171/75. Losses below this level would suggest a more significant near-term high is in place and that a correction may be underway.
Bottom line: Gold is testing resistance at the record high-day close, and the focus is on a reaction off this mark into the close of the year. From a trading standpoint, losses should be limited to 4171 IF price is heading higher on this stretch with a weekly close above 4356 needed to fuel the next leg of the gold rally. Keep in mind we get the release of the Non-Farm Payroll report tomorrow with CPI on tap later in the week. Watch the weekly close here.

Canadian Dollar Price Chart – USD/CAD Weekly
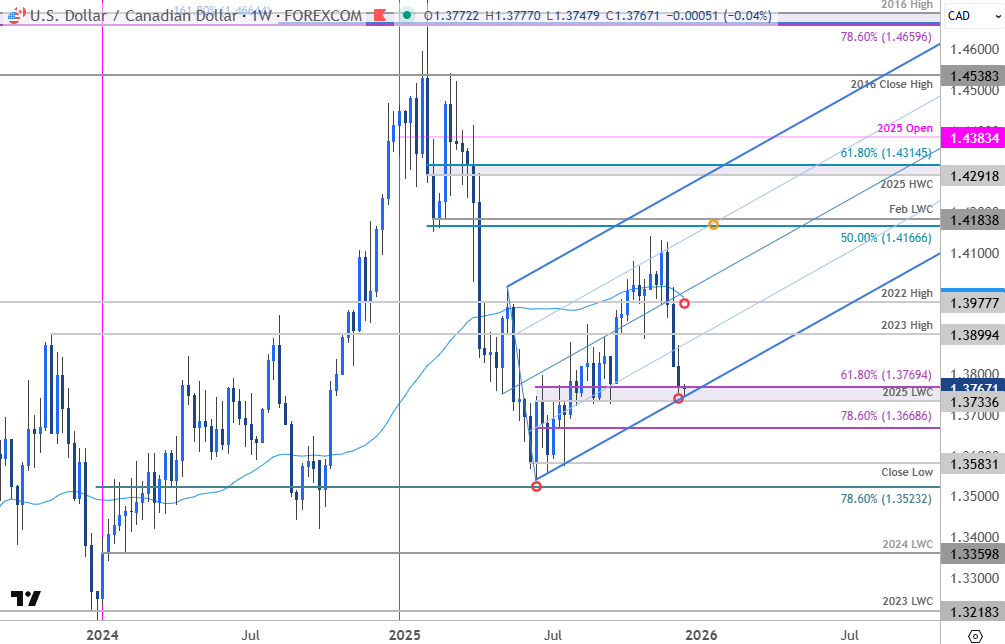
Chart Prepared by Michael Boutros, Sr. Technical Strategist; USD/CAD on TradingView
Notes: USD/CAD plunged into confluent support last week at 1.3734/69- a region defined by the 2025 low-week close (LWC) and the 61.8% retracement of the June advance. Note that pitchfork support converges on this threshold over the next few weeks and the focus is on possible exhaustion / price inflection off this zone.
Weekly resistance is eyed with the 2023 high at 1.3899 and is backed by a more significant pivot zone at the 2022 high and the 52-week moving average at 1.3978/90. A break / weekly close above this threshold would be needed to suggest a more significant low is place and potential resumption of the June uptrend. A break / weekly close below 1.3734 would shift the focus towards subsequent support objectives at the 78.6% retracement at 1.3669 and the weekly close low at 1.3583.
Botton line: USD/CAD is testing pivotal support- risk for possible inflection here with the immediate downtrend vulnerable while above this zone. From a trading standpoint, rallies should be limited to the 1.39-handle IF price is heading lower on this stretch with a close below 1.3734 needed to fuel the next major leg of the decline.
Bitcoin Price Chart – BTC/USD Daily

Chart Prepared by Michael Boutros, Sr. Technical Strategist; BTC/USD on TradingView
Notes: Bitcoin is approaching the lower bounds of the December opening-range, and the stage is set for a breakout in the days ahead. Initial support rests with the 61.8% retracement of the late-November rally and the December low-day close (LDC) at 85,929-86,291. Ultimately, a break / close below 83,712-84.000 would be needed to threaten resumption of the October downtrend. This level is defined by the 2025 low-week close (LWC), the December opening-range low, and the 38.2% retracement of the broader 2022 advance. Subsequent support rests with the 2025 weekly close low and the 2025 LDC at 78,342-79,127, and the March 2024 high / 2025 low at 73,679-74,434. Both these regions represent areas of interest for possible downside exhaustion / price inflection IF reached.
Resistance remains unchanged at 93,347-94,236- a region defined by the objective yearly open, the May low, and the 61.8% retracement of the yearly range. A breach / close above this threshold would be needed to suggest a more significant low is in place and a large trend reversal is underway. Subsequent resistance objectives eyed at the 38.2% retracement of the October decline and the June low at 98,008/240 and the July low at 105,130.
Bottom line: The immediate focus is on a breakout of the December opening-range for guidance here with Bitcoin still vulnerable while within this multi-month downtrend. From a trading standpoint, rallies should be limited to the 94,236 IF price is heading lower on this stretch with a close below 83,712 needed to fuel the next major leg of the decline.
Economic Calendar – Key USD Data Releases

Economic Calendar - latest economic developments and upcoming event risk.
--- Written by Michael Boutros, Senior Technical Strategist
Follow Michael on X @MBForex