
The past few trading sessions have not been particularly favorable for gold, with the precious metal extending a string of consistent losses. Over the last three trading sessions alone, gold has declined by nearly 4.0%, highlighting that the bearish bias remains firmly in place. For now, this selling pressure is largely driven by the renewed appeal of alternative safe-haven markets, a dynamic that continues to limit gold's ability to regain ground consistently. This remains one of the most important catalysts to monitor and, as long as it persists, selling pressure in XAU/USD could remain a relevant theme over the coming trading sessions.

Are Bonds and the U.S. Dollar Still Affecting Gold Demand?
Over recent sessions, market participants have significantly adjusted their expectations regarding U.S. monetary policy. This shift gained additional relevance following the release of the Federal Reserve's October meeting minutes, which highlighted that not all policymakers are comfortable keeping interest rates unchanged and that solid economic conditions alongside persistent inflationary pressures continue to be observed.
As a result, markets have started to consider that there could be more room than previously expected for a more restrictive monetary policy stance in the months ahead. This outlook is already reflected in Fed probability projections, where there is now more than a 90% chance that interest rates will reach the 4.25% area following the December meeting. In addition, probabilities near 70% for the January 27 meeting indicate that rates could rise toward 4.50%, reflecting expectations for a more sustained rate-hiking cycle over the coming months.
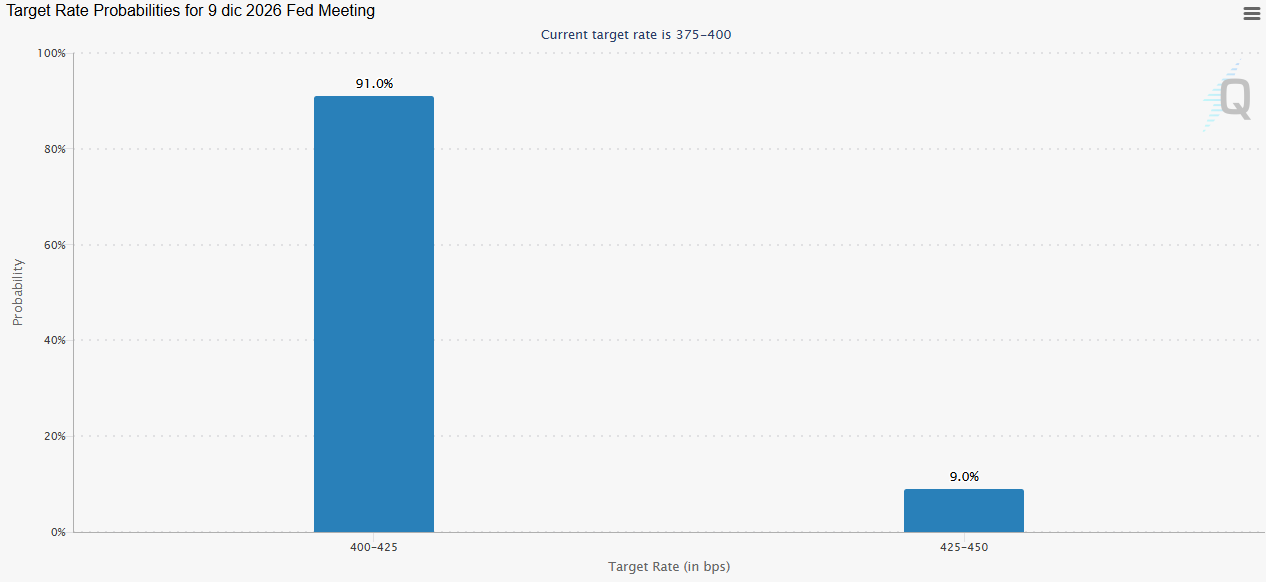
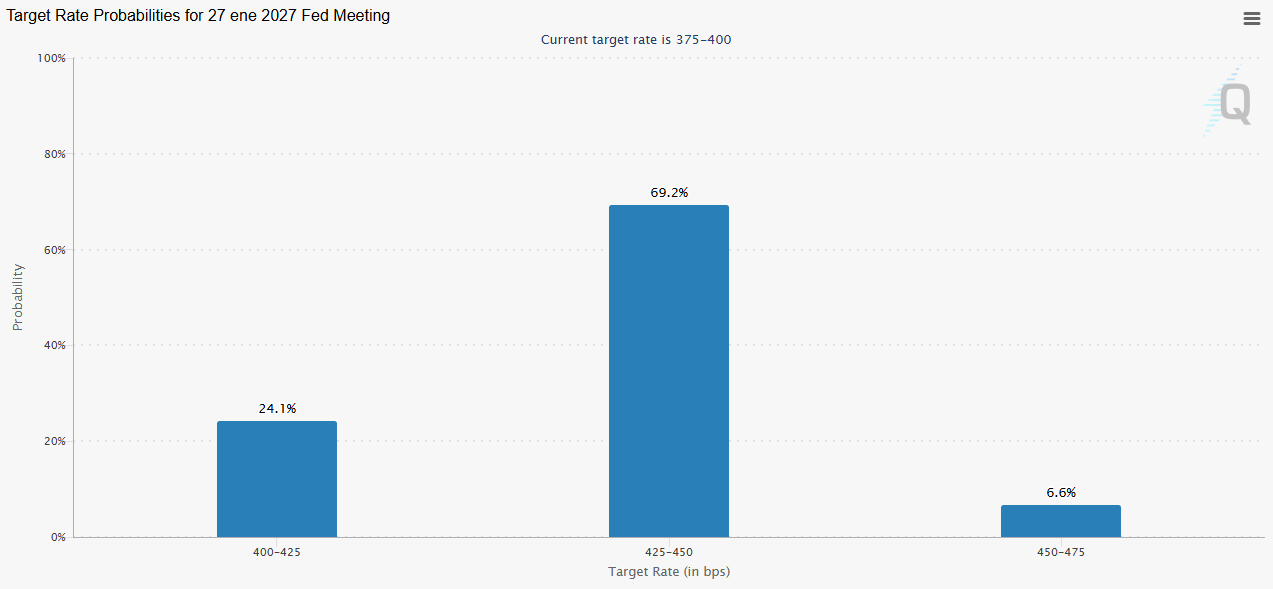
Source: CME
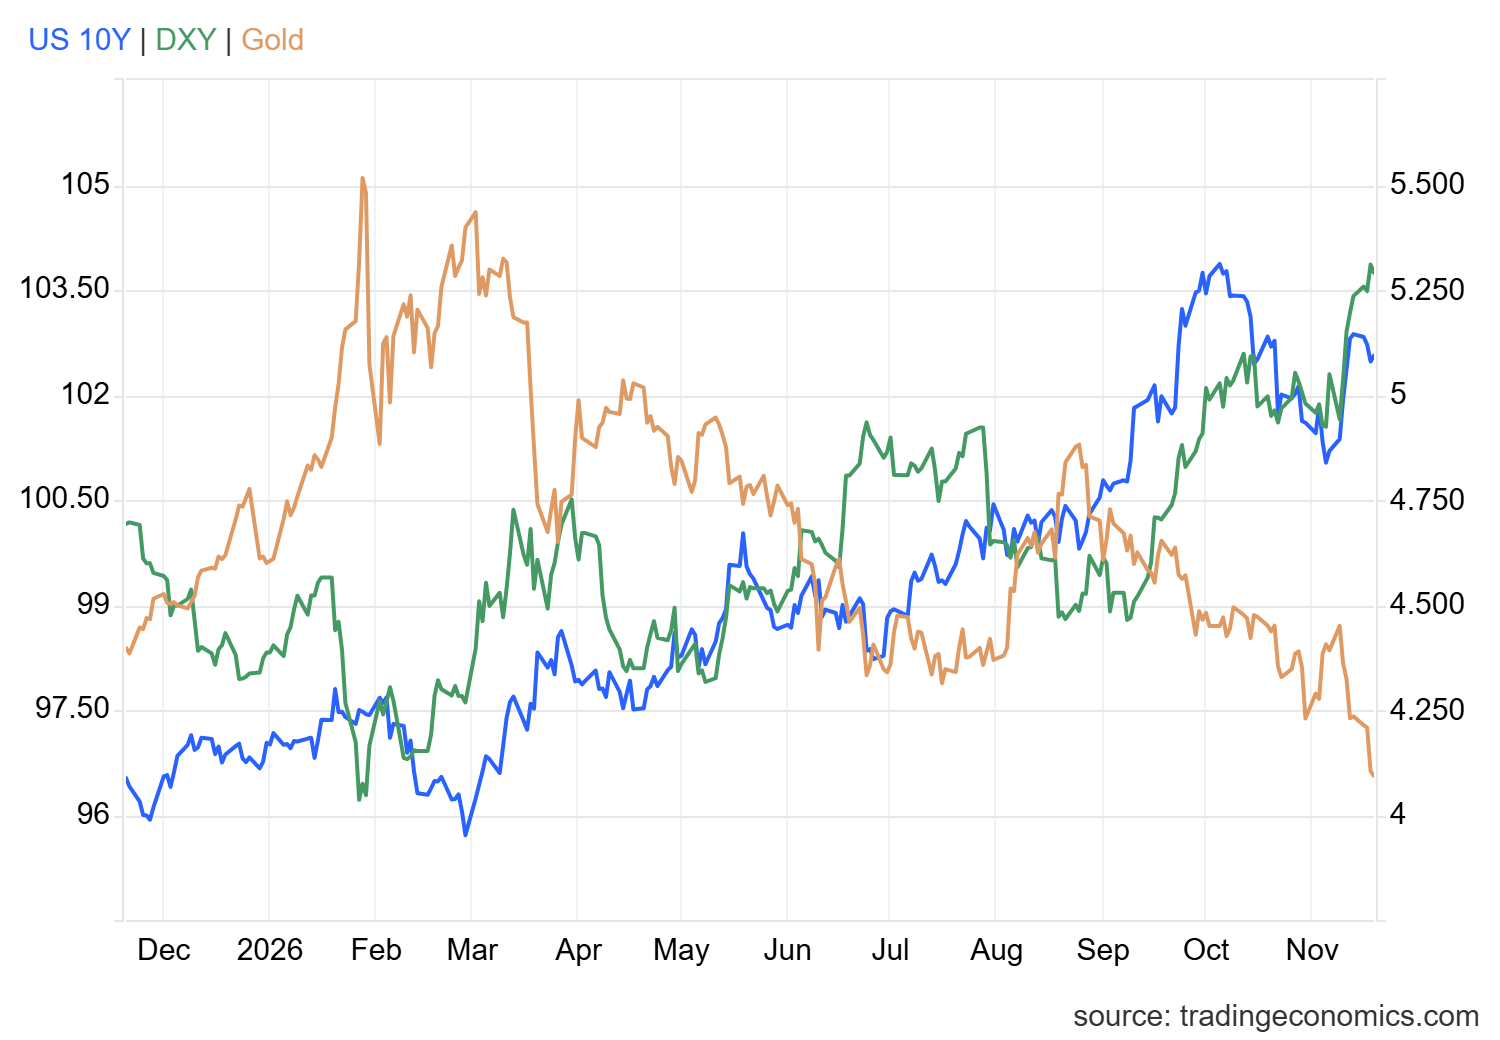
What is important to note is that throughout much of 2026, gold has shown considerable sensitivity to expectations for higher interest rates in the United States. This is largely because a more restrictive monetary policy environment tends to benefit markets that compete directly with gold within the safe-haven space, particularly the bond market and the U.S. dollar.
This dynamic remains clearly visible today. Yields on U.S. 10-year Treasury bonds continue to trade near 5.1%, once again approaching yearly highs, while the DXY Index, which measures the strength of the U.S. dollar against its major peers, continues to advance toward the 104-point area, reflecting steady demand for the U.S. currency.
Interestingly, as these markets continue to gain appeal, gold has responded with a fairly consistent period of weakness. This inverse relationship has been observed several times throughout 2026, but renewed expectations of a more aggressive Fed have once again made it a particularly important factor in the near term.
Source: TradingEconomics
This situation is particularly relevant because gold is a safe-haven asset that does not generate interest or dividend income. As bond yields continue rising, the relative attractiveness of those investments can increase at gold's expense. At the same time, expectations for higher U.S. interest rates may continue to support demand for dollar-denominated assets, strengthening the appeal of the U.S. currency. As a result, both markets continue to act as attractive alternatives for investors and may be limiting demand for gold in the short term.
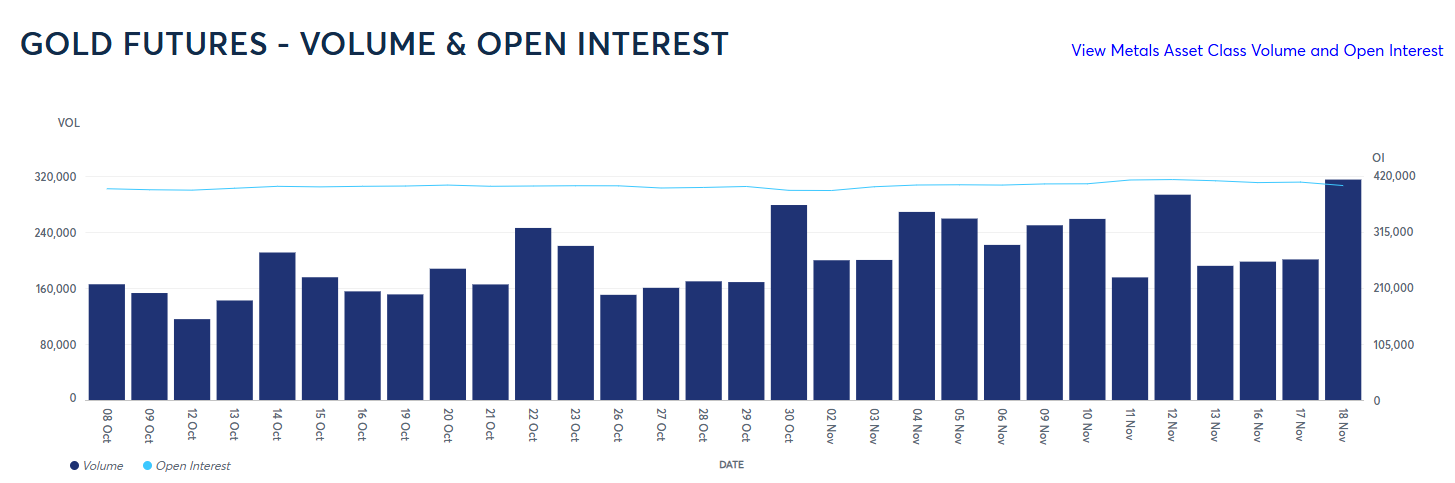
What is particularly noteworthy is that this relative loss of appeal has been reflected not only in recent price action but also in futures market activity. During yesterday's session, trading volume in gold futures contracts exceeded 315,000 contracts, reaching its highest level in more than a month. More importantly, this increase in activity coincided once again with a decline in gold prices, a dynamic that continues to suggest selling pressure becomes more relevant whenever markets receive signals pointing toward a potentially more aggressive Federal Reserve and stronger relative appeal from markets that compete with gold.
Source: CME
As a result, gold continues to face a challenging environment because expectations of a more aggressive Federal Reserve continue to support the relative attractiveness of alternative markets such as the U.S. dollar and the bond market. For now, this dynamic continues to make a sustained recovery in the precious metal more difficult and, as long as markets keep reinforcing this outlook, selling pressure around XAU/USD could remain a relevant feature over the coming weeks.
Gold Technical Forecast
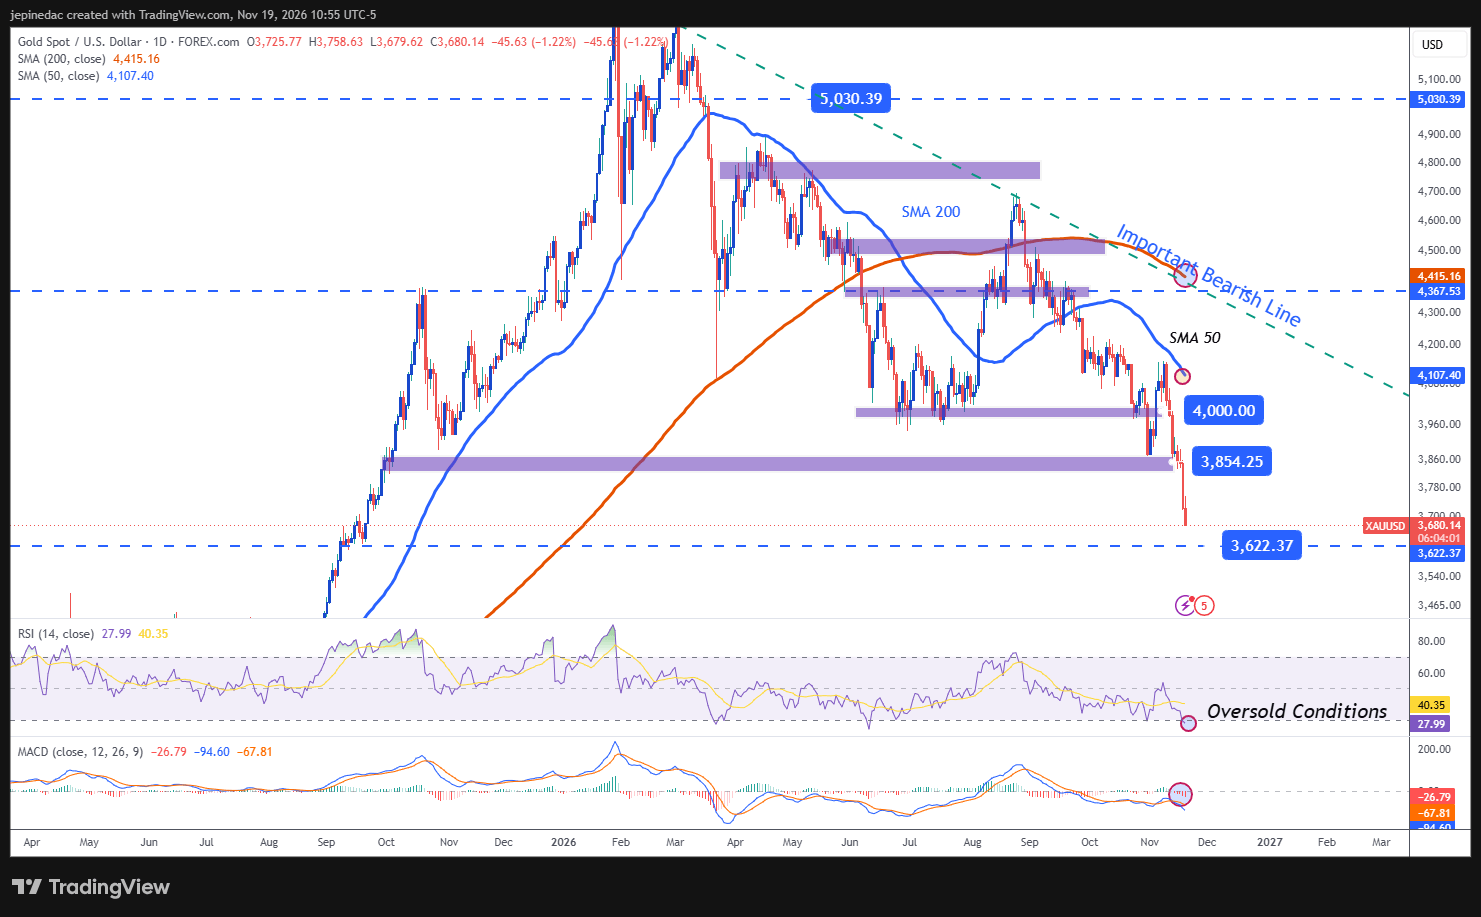
Source: StoneX, Tradingview
- Bearish trend begins to accelerate: Gold has maintained a significant long-term bearish trendline as the dominant chart structure for several months. However, what has become particularly relevant in recent sessions is that the latest decline has pushed through important technical barriers, highlighting increasingly dominant selling pressure. As prices continue moving toward levels not seen since 2025, a more aggressive bearish trendline could begin to gain relevance over the coming weeks.
- RSI: The RSI remains below the neutral 50 level, reflecting that bearish momentum continues to dominate market activity. However, it is also important to note that the indicator has already moved below the 30 oversold threshold, suggesting that recent selling pressure may have become excessive and could begin to create room for potential short-term bullish corrections.
- MACD: The MACD indicator continues to display a histogram consistently below the 0 line, suggesting that bearish momentum remains relevant across short-term moving averages. This dynamic continues to support a dominant bearish bias on the chart, even if there is room for corrective moves in the near term.
Key Levels to Watch:
- $4,000 – Critical Resistance: An important psychological level that currently represents the most relevant upside barrier in the market. Price action returning to this area could begin to challenge the weakness observed in recent sessions and open the door to a broader period of indecision, highlighting a more sustained lack of direction over the coming weeks.
- $3,800 – Nearby Barrier: This area corresponds to recent price retracements and currently stands as one of the most important reference levels on the daily chart. At the moment, it represents the nearest level to monitor in the event that bullish corrective moves begin to develop in the short term.
- $3,600 – Critical Support: A major low and retracement area not seen since September 2025, currently representing the most important downside barrier on the chart. Price action moving increasingly closer to this level could continue to highlight the dominant selling pressure observed in recent weeks. In addition, as prices continue approaching this area or even manage to establish themselves below it, a more aggressive bearish trendline could begin to gain relevance and potentially become the dominant technical structure over the coming weeks.
Written by Julian Pineda, CFA, CMT – Market Analyst
Follow him on: @julianpineda25