FTSE rises, UK economic growth slows
The FTSE is set for a stronger start, in lime with its European peers. The mood in the market is upbeat following news of a call between leaders Xi Jinping and Joe Biden and despite today’s disappointing UK GDP numbers.
The UK economy grew at a slower than expected pace in July. GDP rose just 0.1% MoM, down from 1% in June and missing forecasts of 0.6%. The slower growth came as covid cases rise and the NHS app told huge numbers of workers to self-isolate.
It wasn’t all bad news this morning, industrial production in July came in ahead of forecasts rising 1.2% MoM, versus 0.4% forecast, rebounding from -0.7% declines in June.
Where next for the FTSE?
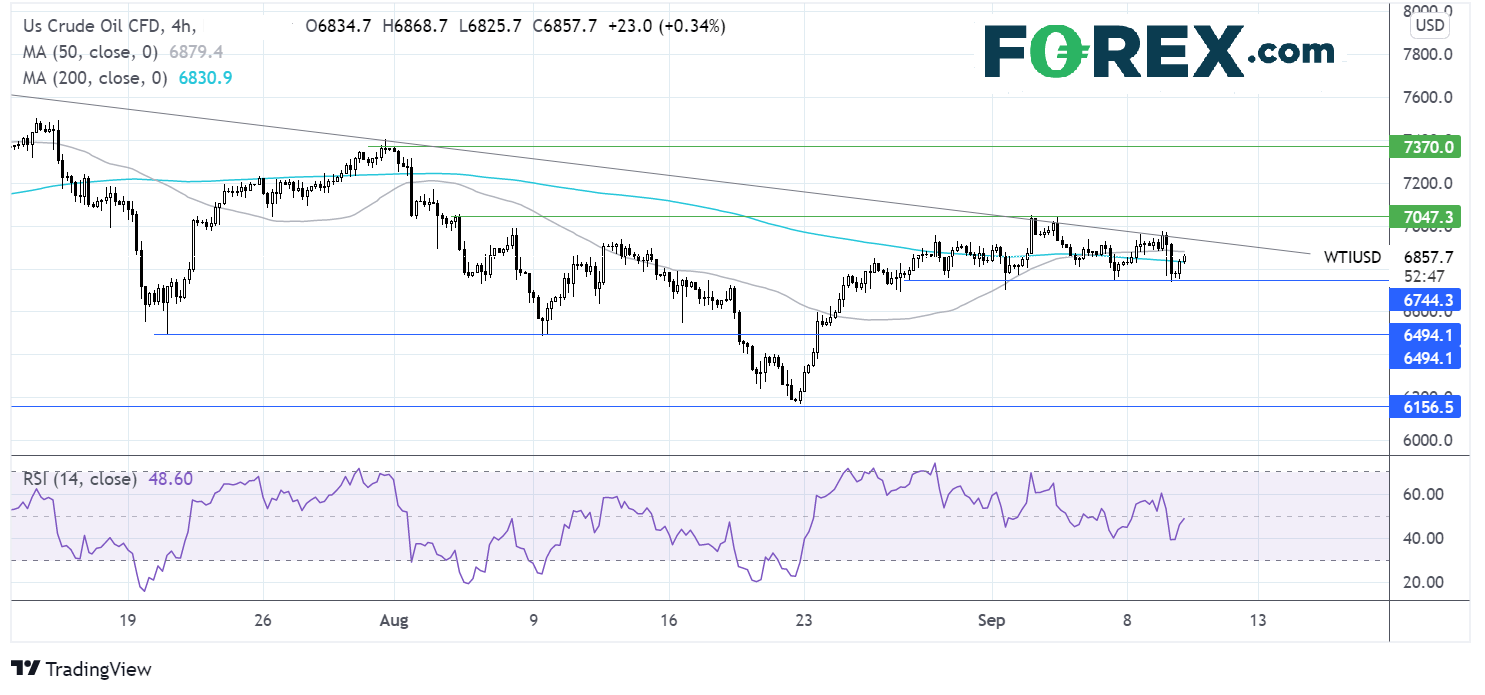
The FTSE has been trending lower across the week finding support yesterday at 6990 before rebounding higher. The receding bearish bias on the MACD is keeping bulls hopeful – a bullish crossover would be a buy signal.
Any meaningful recovery will need to retake 7090 a level which capped losses on several occasions across the end of August. 7120 the 50 & 200 sma could also prove a tough nut to crack.
On the flipside a break below 6990 would be significant, opening the door to further losses towards 6925 the late August low.
WTI crude oil ahead of Baker Hughes rig count
Oil prices are on the rise as tightness in the US oil market in the wake of Hurricane Ida offsets plans by China to sell crude oil from its reserves.
Oil fell on the news that it will release oil into the market by public auction to ease the pressure of high costs on refineries.
Meanwhile, US output is proving to be slow to return following Hurricane Ida 10 days ago. Reduced supply is helping to underpin the market.
The Baker Hughes rig count is due later today.
Where next for crude oil?
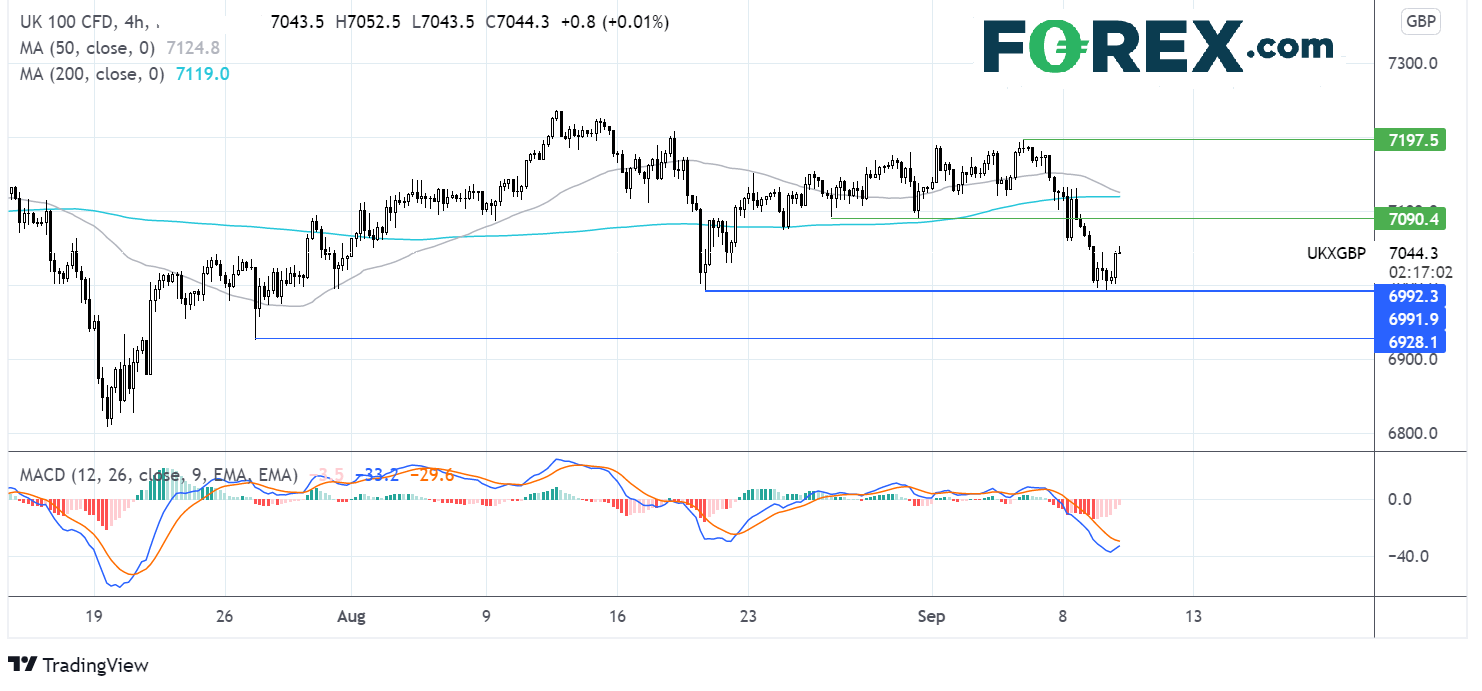
WTI crude is rebounding from steep losses yesterday. The price found support at 67.50 a level which has capped losses several times over the past three weeks. However the price continues to trade below its falling trendline dating back to early July so the dominant trend is still bearish.
Still a move above the 200 sma on the 4 hour chart, combined with the RSI pointing northwards and heading into bullish territory is keeping the buyers hopeful. However, the immediate upside sees several points of resistance, the 50 sma at 68.85 and the falling trendline resistance at 69.50. A move above here could see 70.50 the September high come into play.
Should the 200 sma fail to hold, the price could test 67.50 one again. A break below this level could open the door to deeper losses towards 6500 low 9 August and 61.50 the August low.