
US Dollar Talking Points:
- Continuing from last week’s webinar, the USD rally has continued following a four-week failure from sellers whilst at support.
- Some major levels are in-play with EUR/USD testing 1.1000 and USD/JPY testing 160.00.
- The second half of the webinar focused on macro themes in the Nasdaq and S&P 500, along with NVDA ahead of a crucial earnings report later today.
In last week’s webinar we started off with the value of weekly charts, highlighting a possible breakout in the USD after the currency had spent four weeks testing support. As of last Tuesday’s webinar, there was already a wide underside wick, showing bulls gaining control, and that very much continued through the end of last week as the currency has sent pushed up to a fresh 19-month high, setting the stage for this week’s session as several inflection points have shown across the FX market.
US Dollar Weekly Chart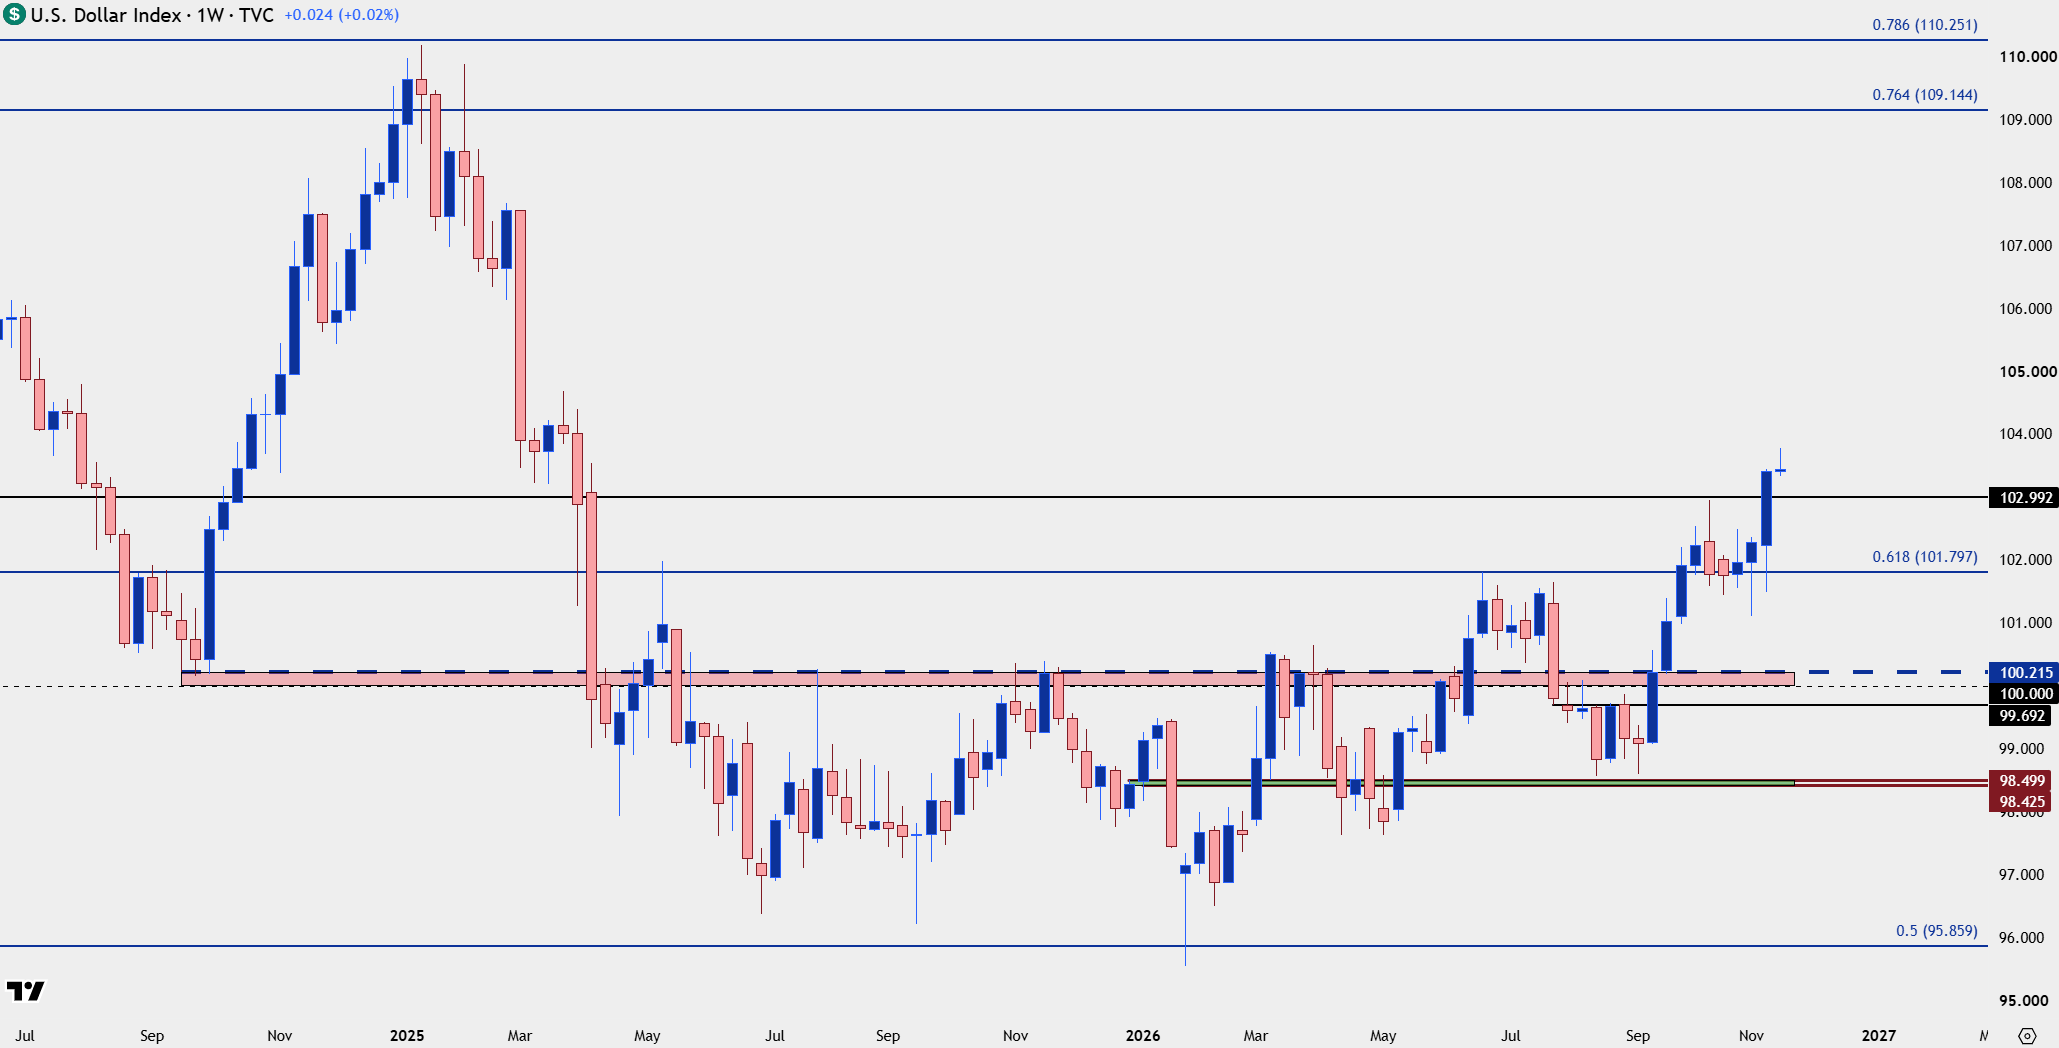
Chart prepared by James Stanley; data derived from Tradingview
USD/JPY
At the top of the list for USD-strength setups last week was USD/JPY which, at the time, was holding in an inverse head and shoulders pattern. Price broke out aggressively a day later, and that has sent the pair up for its next test of the 160 handle which has so far held.
That said, the pullback from 160 has been bid with the underside wick on the daily, and that sets the table for another test of the big figure after which there could be short-term bullish breakout potential.
USD/JPY Daily Chart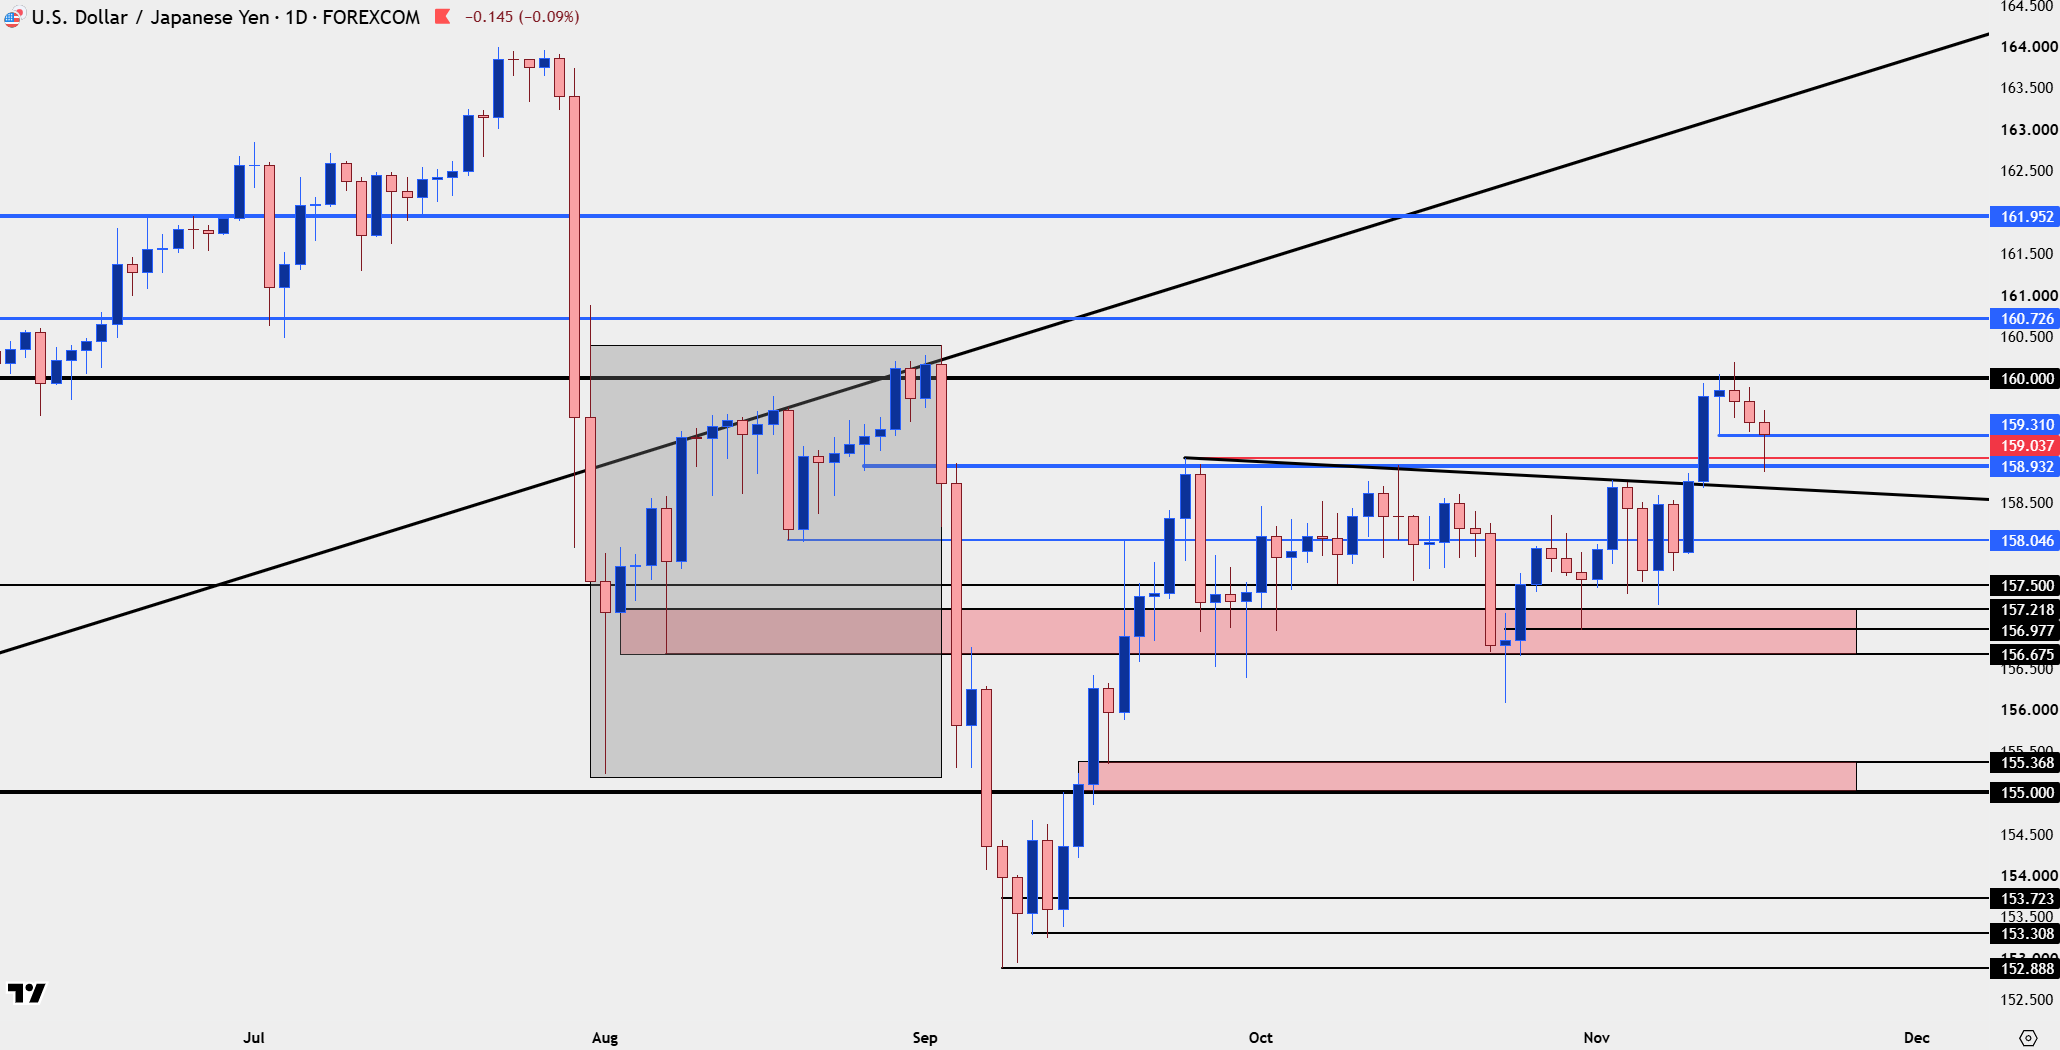
Chart prepared by James Stanley; data derived from Tradingview
EUR/USD
Also on the tune of the weekly chart, we looked at EUR/USD in the prior webinar with an opening door for breakdown. That has since filled in and the pair has already tested the 1.1000 level that I was highlighting then.
This is a major level for EUR/USD and given the importance of the FX market for multinational companies and reserve banks, similar psychological levels can often provoke support or resistance bounces. The 1.1026 level is key for that theme in the near-term, although for USD-weakness, I still think GBP/USD is more attractive at this point.
EUR/USD Weekly Price Chart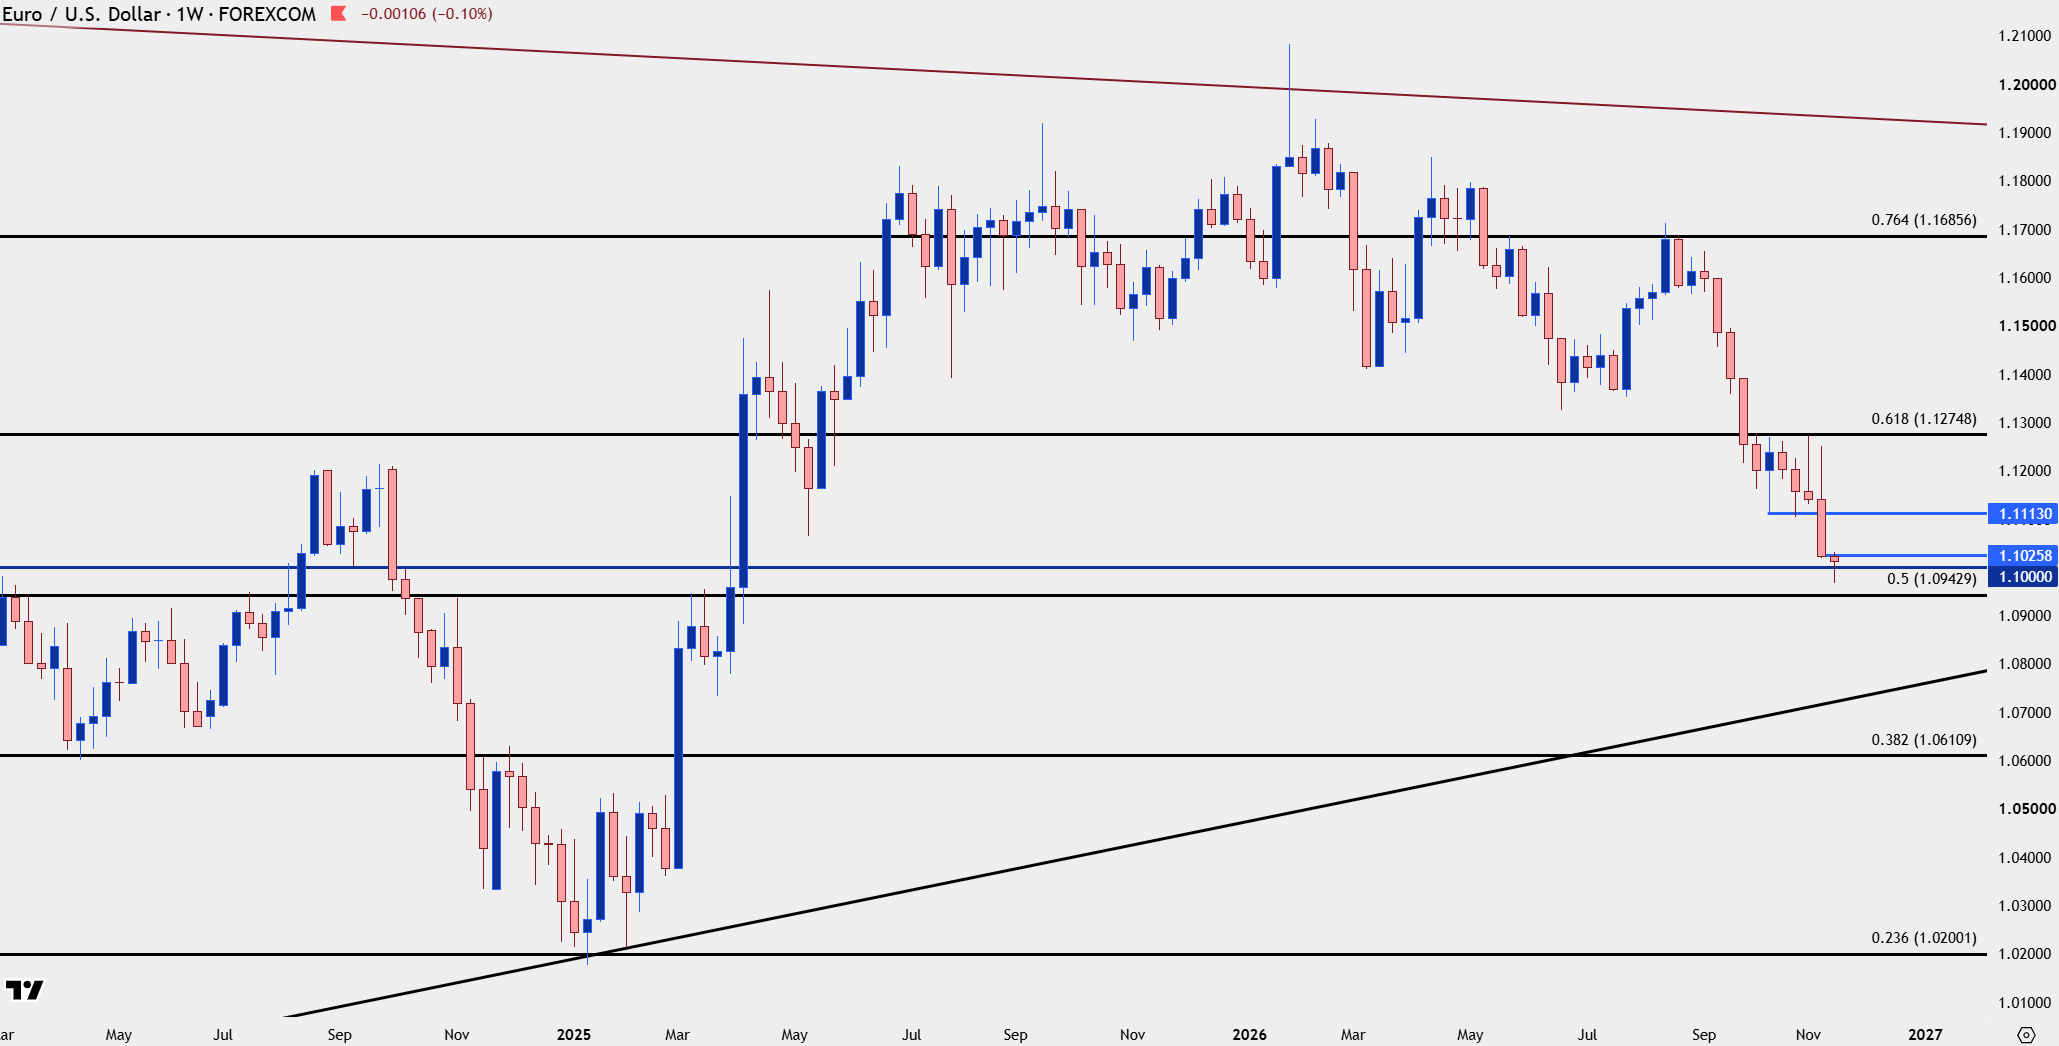
Chart prepared by James Stanley; data derived from Tradingview
GBP/USD
For USD-weakness, I think GBP/USD is still better structured for such scenarios, as price remains in what’s been a rather consistent range, very near support around the 1.3200 handle.
GBP/USD Weekly Chart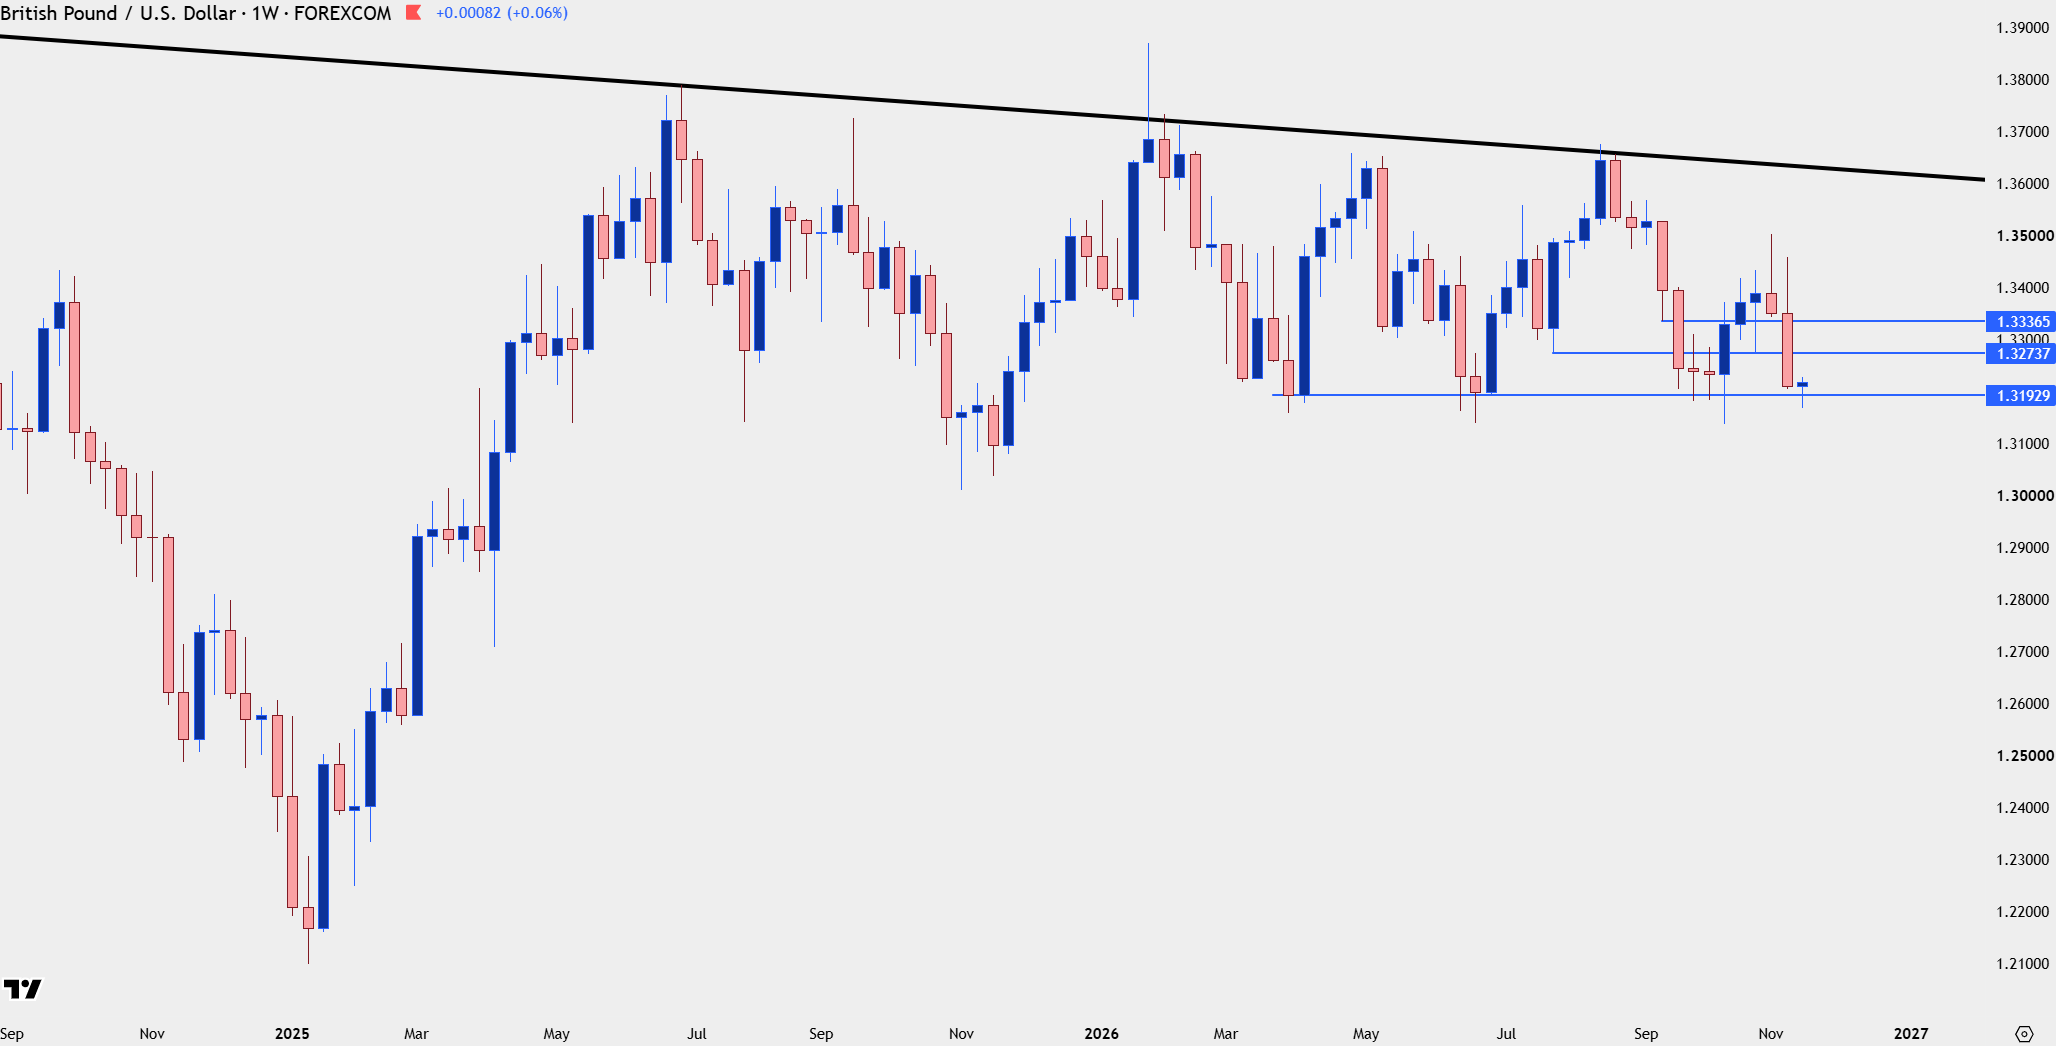
Chart prepared by James Stanley; data derived from Tradingview
USD/CAD
USD/CAD has been a favorite for USD-strength themes, with the major pair showing a feast and then famine backdrop as a hyperbolic options to wider DXY themes. And as such, the pair has shot higher from the test below 1.4000 just a couple weeks ago.
The challenge at this point is the pair, like the USD, is at a fresh 19-month high. It’s a difficult area to chase price higher, but given recent dynamics there are a few spots of interest for higher-low support potential.
USD/CAD Daily Price Chart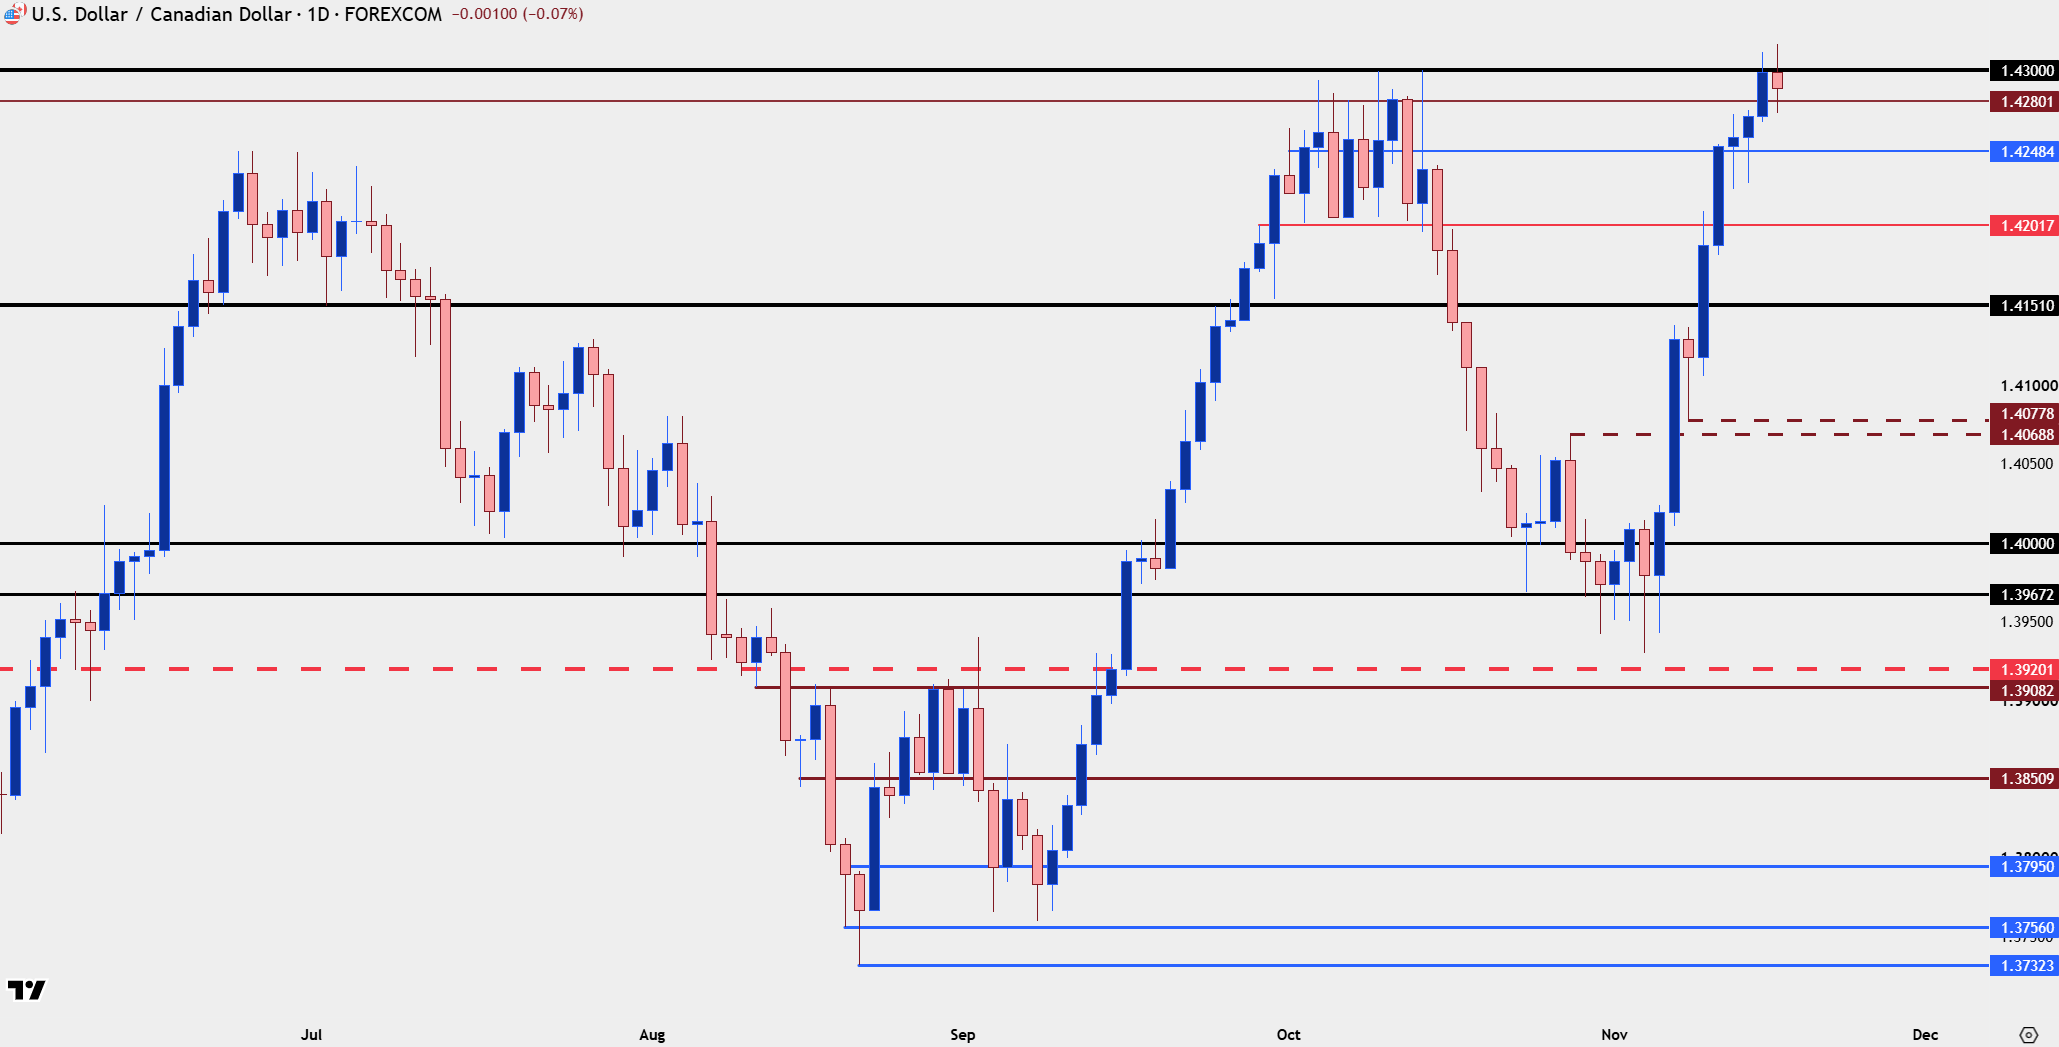
Chart prepared by James Stanley; data derived from Tradingview
--- written by James Stanley, Senior Market Analyst, Global Macro