GBP/USD Bounce in Focus as USD/CAD and GBP/CAD Offer Clues
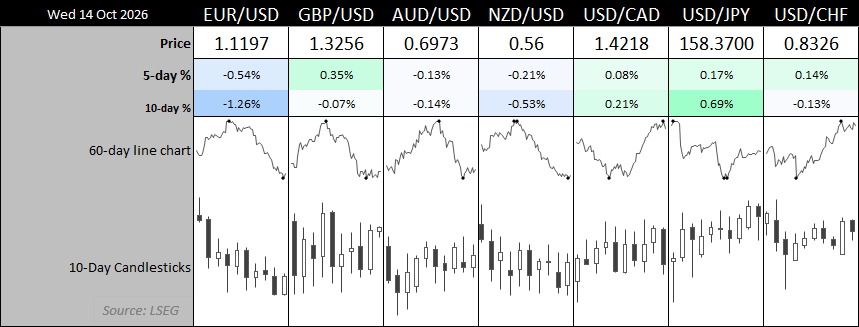
Markets are eagerly awaiting September’s US inflation figures later today. Naturally, inflation is expected to heat up given the rise in crude oil prices amid renewed tensions in the Middle East. But with the US dollar already rallying to recent cycle highs on hawkish Fed bets, CPI may need to exceed elevated expectations to justify further gains.
This generally creates a ‘for or against the USD’ environment for FX majors, as correlations strengthen and price action becomes increasingly driven by the US dollar. But among the FX majors, GBP/USD has caught my eye for a potential bounce, given the price action clues from USD/CAD and GBP/CAD.
View related analysis:
- USD/CAD Rally Looks Stretched, But CAD Bears Eye AUD and GBP
- AUD/USD Stuck Below 70c Amid Hawkish RBA, Weak Business Sentiment
- Gold Hints at Quiet Accumulation Despite Persistent US Dollar Strength
- Swissy Attracts Safe-Haven Bets, AUD Shorts Surge to Record High | COT report
USD/CAD Technical Analysis: US Dollar vs Canadian Dollar
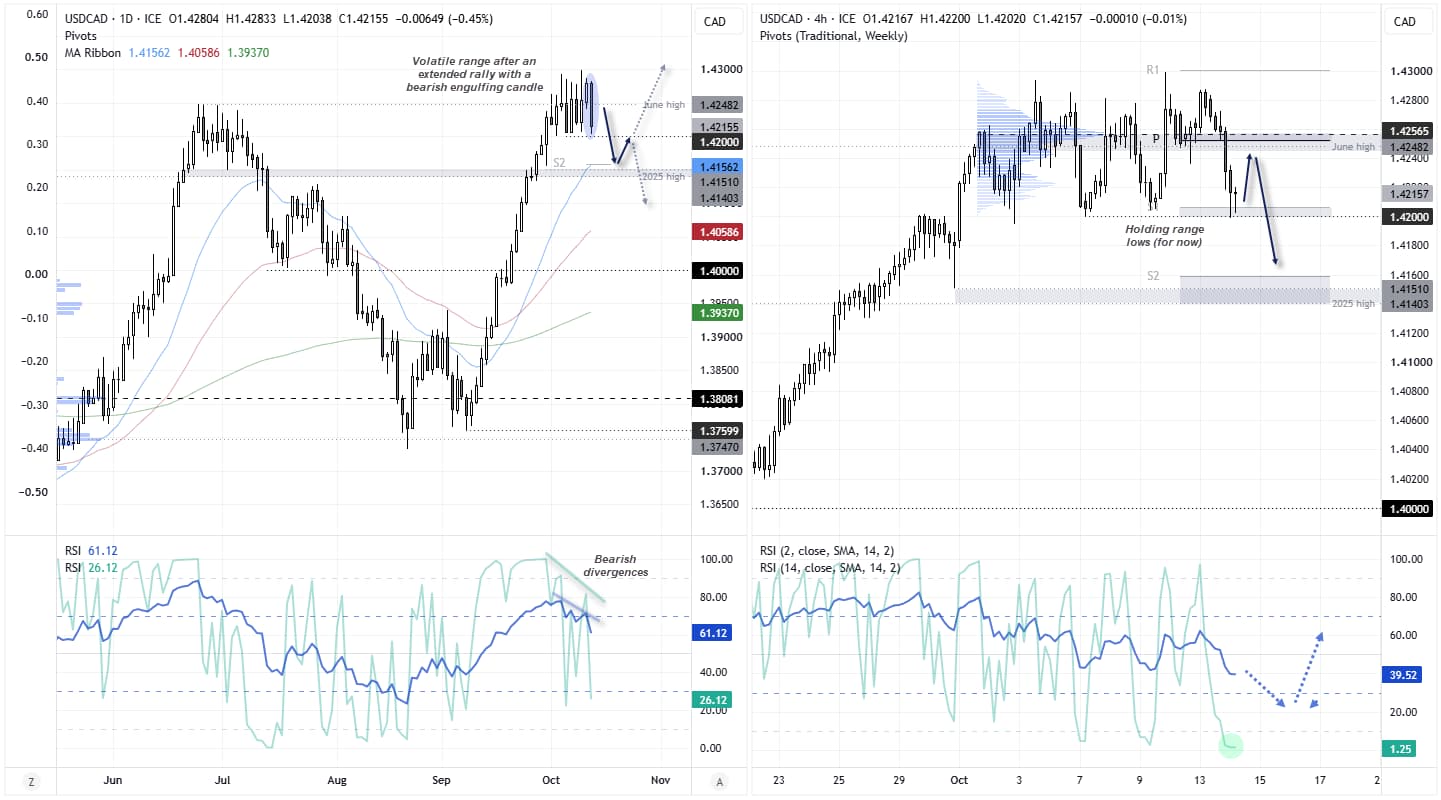
The daily chart shows a strong rally from the September low to last week’s high, delivered in a remarkably straight line. Yet with no meaningful pullback so far, and signs of a shakeout emerging ahead of US inflation data, USD/CAD may finally be primed for a retracement.
USD/CAD has traded within a volatile, sideways range of around 100 pips, with Tuesday’s bearish engulfing candle being the most volatile of the range. Combined with bearish divergences on the daily RSI (2) and RSI (14), both in overbought territory, it might not take much of a CPI miss for bears to retain control.
Note that the 2025 high, weekly S2 pivot and 20-day EMA converge around 1.4500, making this a potential downside target for bears during the anticipated retracement.

USD/CAD Outlook: Bears Eye Break Below Range Support
However, the 4-hour chart shows the weekly S1 pivot providing support near the range lows for now. And with US CPI looming, the dollar could attract a last-minute bid ahead of the release, allowing for some bullish mean reversion within the range.
But while prices remain within the range and below its high, the near-term bias favours a downside break towards the 1.4150 support cluster.

Source: ICE, TradingView
GBP/CAD Technical Analysis: British Pound vs Canadian Dollar
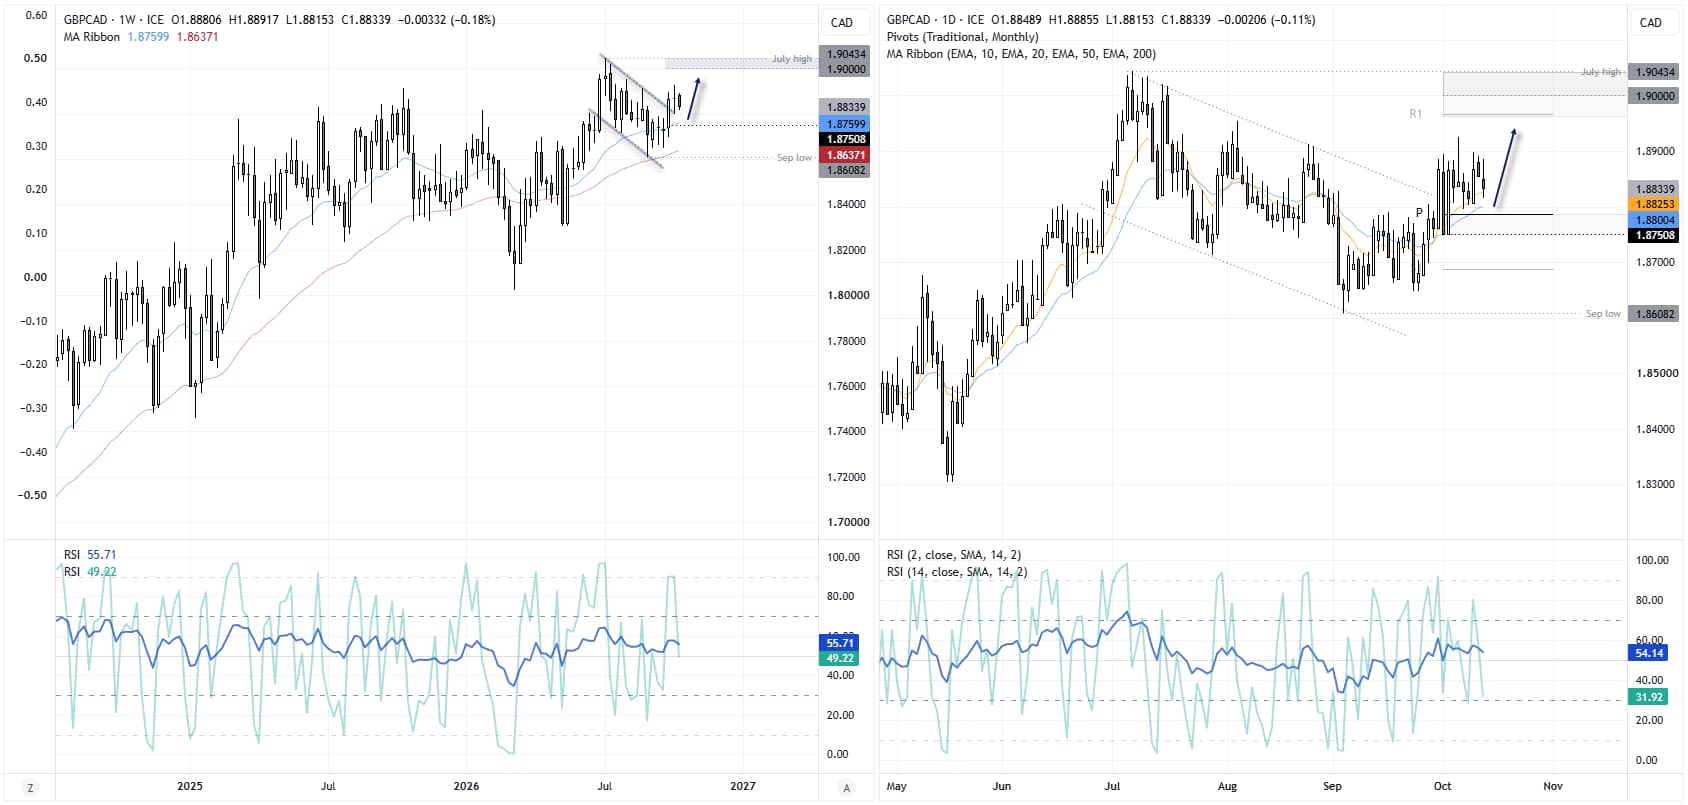
Granted, price action is a little messy on the daily chart – but GBP/CAD retains a bullish structure overall. The weekly chart shows the uptrend recently found support around the 50-week EMA with a spike low, while momentum has since broken higher from a bearish corrective channel.
That said, a rickshaw doji formed last week, and prices are now retracing against the bullish range expansion candle. Though with several support levels nearby, I am seeking evidence of a swing low on the daily chart.
GBP/CAD has formed a two-day pullback within Friday’s bullish range, while holding above the 10- and 20-day EMAs for now. The monthly pivot point sits just above 1.8800, so I’m waiting for bullish momentum to return, potentially paving the way for a move towards monthly R1 at 1.8966 or the 1.9000 handle.
Source: ICE, TradingView
GBP/USD Technical Analysis: British Pound vs US Dollar
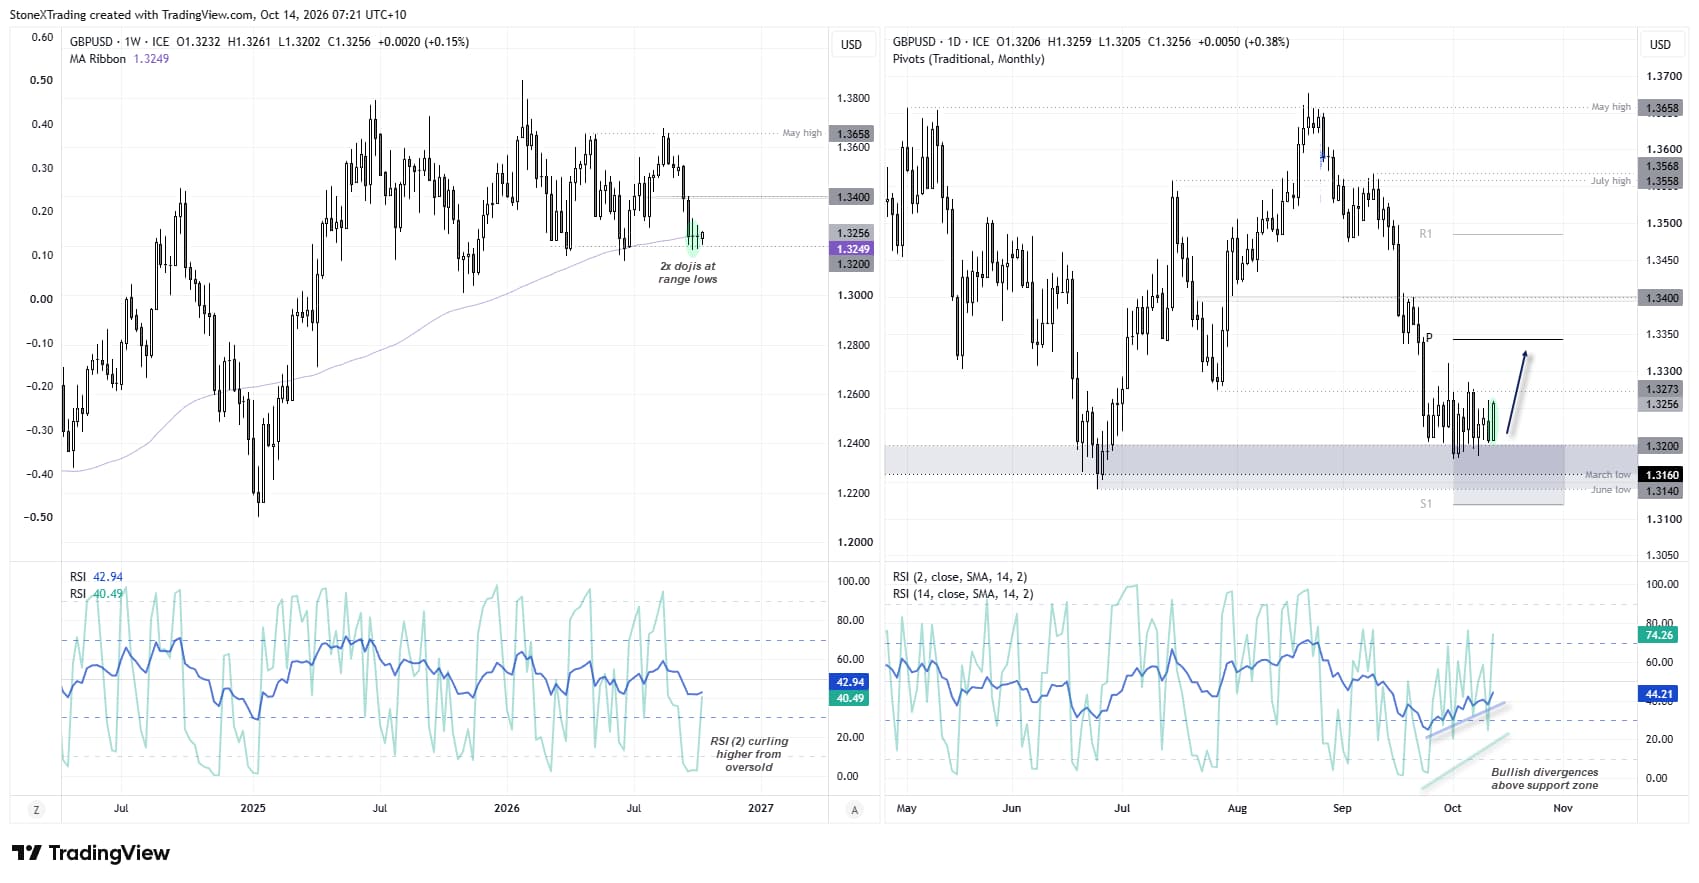
Interestingly, if my assumptions of a pullback in USD/CAD and a rebound in GBP/CAD prove correct, it should bode well for GBP/USD. And the fact that Cable has now produced two rickshaw dojis on the weekly chart near the bottom of its range, around the 1.3200 handle, also supports my hunch for a bounce.
The daily chart shows a volatile shakeout over the past 13 days. Much like a dog violently shaking a toy to wrestle it from someone's hand, markets can behave in a similar way before finally breaking free. Given we're seeing a volatile shakeout near range lows while support levels continue to hold, my assumption is that GBP/USD could be preparing for a bounce.
Tuesday's bullish engulfing candle could provide the trigger, particularly if today's US CPI report allows the dollar to pull back from its recent rally.
Source: ICE, TradingView