



AUD/NZD, AUD/USD, ASX 200 Analysis: NZ enters a technical recession
The Fed delivered the hawkish pause with rates remaining at 5.00-5.25%, but warned of another 50bp hikes by December.
Share this:

Market summary
- The Fed delivered the hawkish pause with rates remaining at 5.00-5.25%, but warned of another 50bp hikes by December
- 2023 Forecasts: Fed Fund futures increased to 5.6% (5.1% prior), GDP up to 1% (0.4% prior), unemployment lowered to 4.1% (4.5% prior), PCE inflation lowered to 3.2% (3.5% prior) Core PCE lowered to 3.9% (3.6% prior)
- Fed fund futures currently imply a 64.5% chance of another 25bp hike in July, or a 60.5% chance of one in June
- The 2-year yield rose to a 3-month high of 4.8% before pulling back to close at a 3-month high
- US indices initially fell and the Dow Jones hit a 3-day low, but by the close the Nasdaq had closed above 15k and the S&P 500 had erased earlier losses to close with a Spinning Top candle
- With other central banks facing further pressures to hike, the US dollar was in fact the weakest FX major whilst NZD, AUD and CHF were the strongest
- EUR/USD reached a 3-week high before pulling back to close beneath its 50-week EMA, AUD/USD rose to a 16-week high but closed back below 68c (a key resistance level since the RBA paused in April), USD/JPY handed back most of Wednesday’s gains before closing back above 140 and remaining within its recent consolidation range
- There was no major breakout on gold or oil either, with gold holding above last week’s low and WTI falling back beneath $70 after an intraday break above it
- The DAX closed at a record high, the close was just beneath its intraday high of 16,331.94 after a brief spell above it
- Australian consumer confidence fell -3.1 points to 72.7 after the last RBA hike, with the ANZ-Roy Morgan report citing deteriorating buying conditions
- NZ GDP contracted for a second consecutive quarter to earn the economy a ‘technical recession’ tag
- The IMF warned that the RBNZ may need to hike rates again and keep them elevated for some time


Events in focus (AEDT):
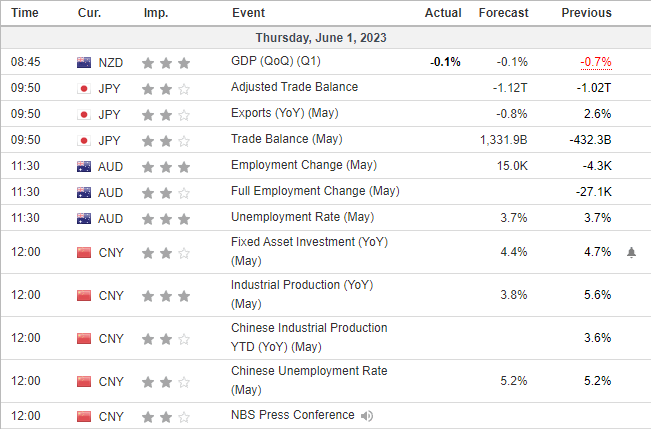
- 08:45 – New Zealand GDP
- 09:50 Japan’s trade balance
- 11:30 – Australia’s employment report
- 12:00 – China’s industrial production, investment, unemployment, NBS press conference
AUD/NZD daily chart:

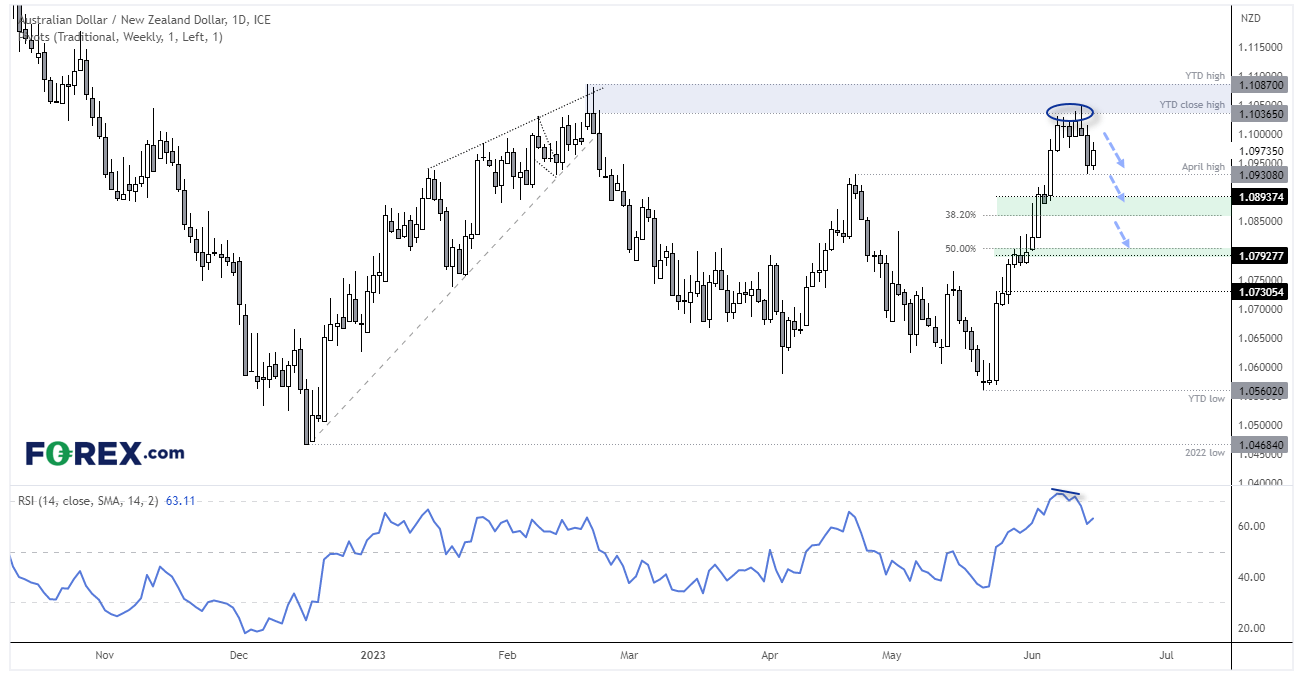
AUD/NZD failed to close above the YTD close high (despite several attempts) or even retest the actual YTD high before momentum turned lower on the daily chart. Prices fell towards the April low ahead of today’s GDP report, where the negative quarterly print weakened the NZD and helped recoup much of yesterday’s losses. Whether it can bounce further is likely down to how strong today’s Australian employment print is, but with the RBNZ holding the higher interest rate (and the IMF hinting that further hikes may be needed) then it may struggle to break back above this week’s high.
From here, we’re looking for evidence of an intraday lower high (beneath this week’s high) to assume the next leg lower, which could be confirmed with a break of the April high. A break of which brings the support zones around 1.0850 and 1.0800 into focus for bears. A weak Australian employment report could help it move bac towards the daily lows in a few hours.
AUD/USD 1-hour chart

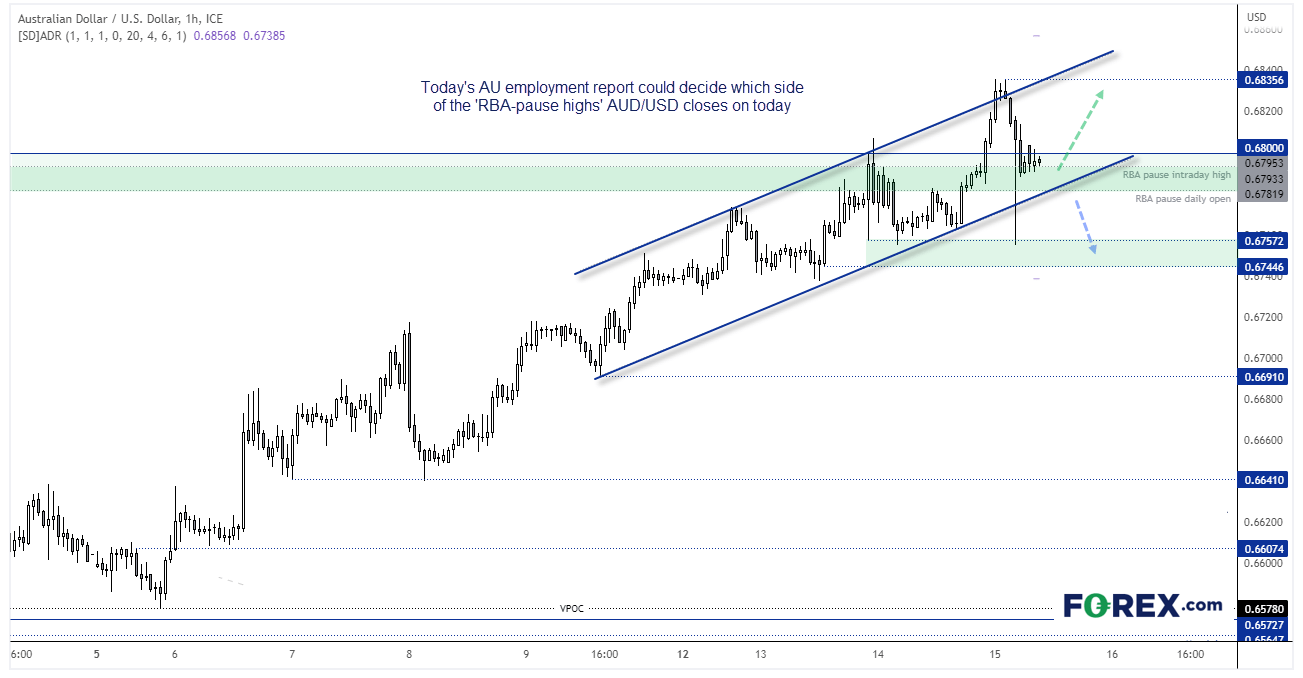
We noted the importance of the 0.68 handle earlier this week, as AUD/USD has tried (but failed) several times to break and hold above it. But the market has also struggled around the April 4th highs just below 0.68 as it marks the day the RBA first held rates steady, yet AUD/USD has struggled to break above this key level despite two further RBA hikes. Whilst the Fed’s hawkish pause keeps the pressure on the RBA to hike further and helped the Aussie break above these key levels, it is likely down to today’s employment repot as to which side of the 0.6720 – 0.6733 zone (or 0.6800 handle) it closes on. As another strong employment report likely tips the RBA’s hand to hike, given the Fed’s latest hawkish message. The 0.6835 comes into focus for bulls but the 20-day average daily range sits around 0.6850, whilst a break beneath trend support brings the low around 0.6750 into focus.
ASX 200 at a glance:
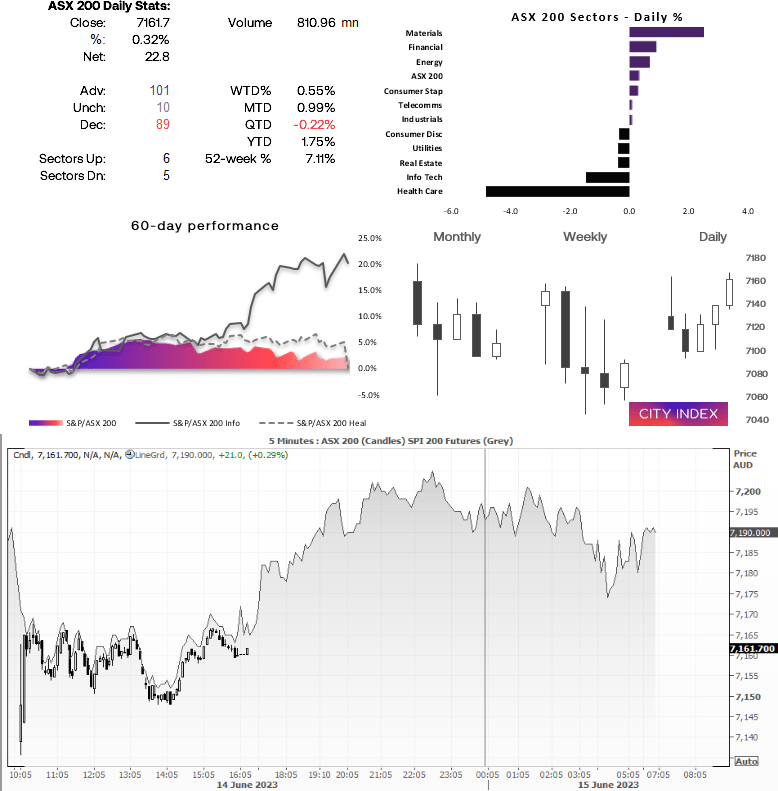
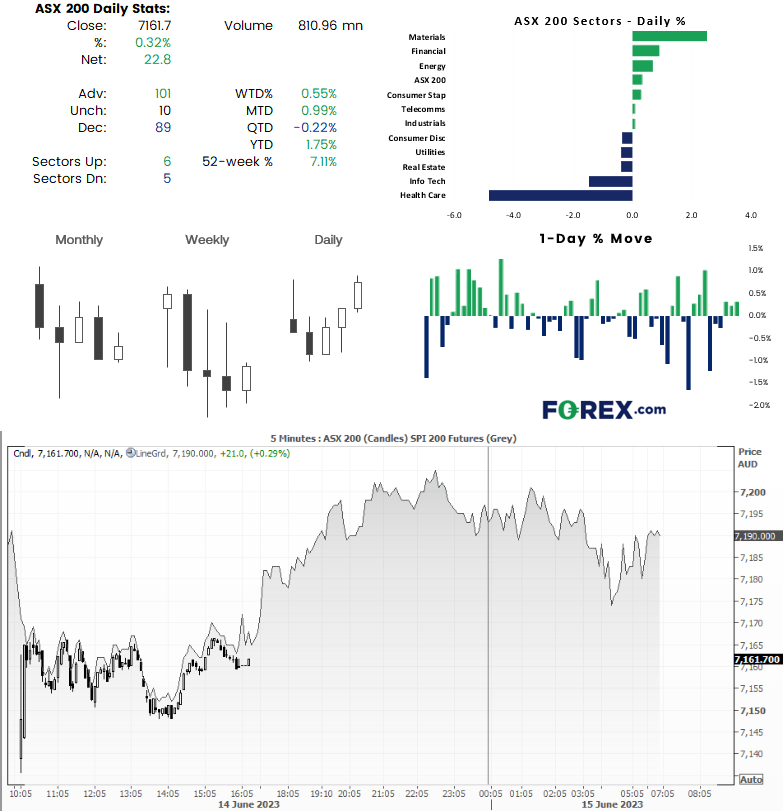
- Third day higher for the ASX 200
- SPI futures rose 0.29% overnight
- Intraday support: 7148, 7131.2, 7100-7102
- Intraday resistance: 7160-7165, 7185, 7200
Asia Data Calendar (AEDT):
-- Written by Matt Simpson
Follow Matt on Twitter @cLeverEdge
How to trade with City Index
You can trade with City Index by following these four easy steps:
- Open an account, or log in if you’re already a customer
• Open an account in the UK
• Open an account in Australia
• Open an account in Singapore
- Search for the market you want to trade in our award-winning platform
- Choose your position and size, and your stop and limit levels
- Place the trade
Related tags:



The complete CFD trading experience
Award-winning platforms, competitive spreads, low commissions and dedicated support.
We live and breathe the markets and are dedicated to helping traders realise their ambitions as we continue to set the industry bar.
Economic calendar
Web Trader platform
Our sophisticated web-based platform is packed with features.
Related articles
EUR/USD forecast: Eurozone stagflation risks mount as dollar holds firm ahead of data
The dollar was bouncing back at the time of writing, after it had eased overnight on the back of some weaker-than-expected economic data yesterday which had prompted markets to scale back expectations of an October Fed rate hike. However, with more significant US data due today and Friday, and with oil prices continuing to remain elevated, the dollar’s broader direction remains bullish.

NZD/USD pressure mounts as payrolls looms large
NZD/USD has fallen sharply as Fed rate expectations reset higher, but extreme downside stretch and major support raise the risk of a violent counter-trend rebound.


US Core PCE Preview: Stale or Significant for the Fed
Core PCE inflation takes center stage Wednesday, with traders watching for signs of renewed price pressure and clues on whether the Fed could hike again in October.

StoneX Europe Ltd may make third party material available on this website which may contain information included but not limited to the conditions of financial markets. The material is for information purposes only and does not contain, and should not be construed as containing, investment advice and/or investment recommendation and/or an investment research and/or an offer of or solicitation for any transactions in financial instruments; any decision to enter into a specific transaction shall be made by the client following an assessment by him/her of their situation.
StoneX Europe Ltd makes no representation or warranty and assumes no liability as to the accuracy or completeness of the information provided, nor any loss arising from any investment based on a recommendation, forecast or other information supplied. You should always seek independent advice as to your suitability to speculate in any related markets and your ability to assume the associated risks, if you are at all unsure. We are not under any obligation to update any such material. Any opinion made may be personal to the author and may not reflect the opinion of StoneX Europe Ltd.