



Bitcoin & Nasdaq Forecast: Is Another Drawdown Ahead for Risk Assets?
Bitcoin and Nasdaq Forecast: Rising rate hike expectations, stronger DXY, and renewed US-Iran tensions increase pressure on risk assets.
Share this:

Risk assets face mounting pressure as rising rate hike expectations and renewed US-Iran tensions weigh on investor sentiment.
Two Key Market Drivers in Focus
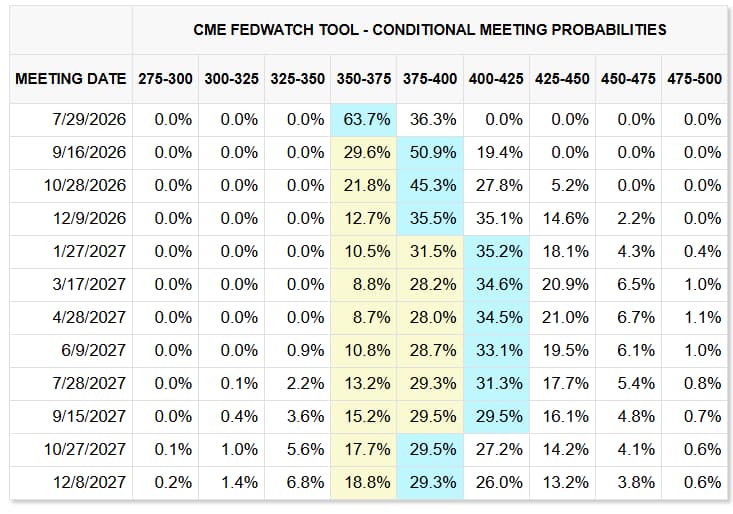
- Rate hike expectations rise over 50% towards year end.
- Progress on the US-Iran peace deal has stalled amid disagreements over Iran's nuclear program and developments on the Lebanon front.
CME FedWatch Tool
Source: CME
Following Kevin Warsh's hawkish tone, expectations for tighter monetary policy have strengthened, while renewed geopolitical uncertainty has added another layer of pressure across financial markets.
As a result:
- DXY is testing one-year highs near 101.
- USDJPY is trading near two-year and multi decade highs around 161.
- Gold and silver have retreated toward yearly lows near 4120 and 65 respectively.
- Nasdaq remains under pressure below 30,400, coinciding with a decline of more than 20% in SpaceX shares from their 225 peak.
- US 2-year Treasury yields have returned toward yearly highs above 4%.
- Crude oil has rebounded from the 73.50 low toward 76.
I discuss these charts and scenarios daily during the MENA Market Call.
Bitcoin Price Forecast: Daily Time Frame – Log Scale
Source: TradingView
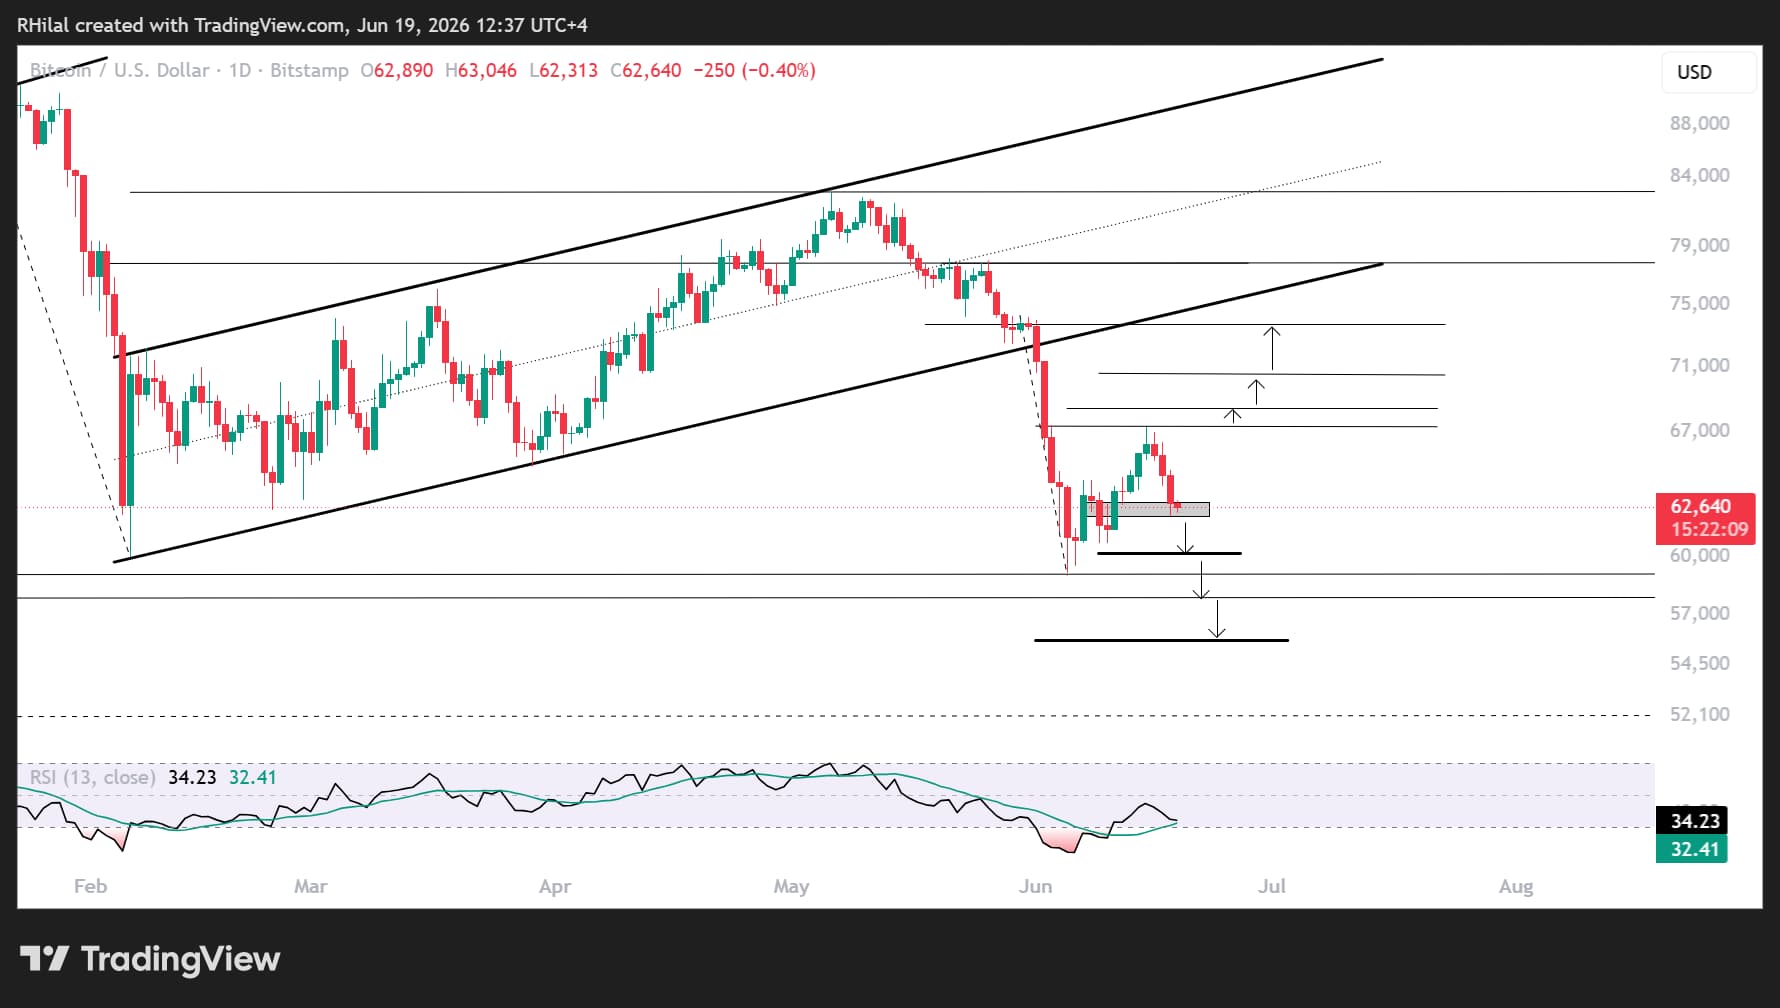
Dominant Framework: Bitcoin Remains Under Pressure Below 67,000
Bitcoin remains under pressure below the 67,000 resistance zone, which coincides with the 44% Fibonacci retracement of the May 26–June low decline.
This comes despite a rebound from the yearly low near 59,000 and a recovery from oversold momentum conditions not seen since 2022.
The recovery remains fragile and closely tied to broader market sentiment, particularly the interaction between elevated AI-related valuations, rising interest rate expectations, and geopolitical developments in the Middle East, all of which continue to influence liquidity conditions across risk assets.
Bearish Scenario – Breakdown Below 62,000
A breakdown below the 62,000 support level would expose the following downside targets:
- 59,000
- 55,000
- 48,000
This represents approximately another 10,000-point downside move from current levels.
The region aligns with the August 2024 lows and may provide another attractive long-term dip-buying opportunity for investors.
Bullish Scenario – Reclaiming 65,000 and 67,000
If bullish momentum strengthens and Bitcoin reclaims both the 65,000 and 67,000 resistance levels on a closing basis, attention would shift toward:
- 68,000 (50% Fibonacci retracement) of the May 26–June low decline
- 70,000 (61.8% Fibonacci retracement)
- 74,000 (78.6% Fibonacci retracement and the lower boundary of the previously respected channel)
This setup mirrors the technical framework currently developing in silver.
A sustained breakout above these levels would significantly strengthen the bullish case, opening the path toward the 90,000 region and potentially new record highs over the longer term.
For now, bearish dominance persists.
Nasdaq Price Forecast: 4H – Daily Time Frame – Log Scale

Source: TradingView
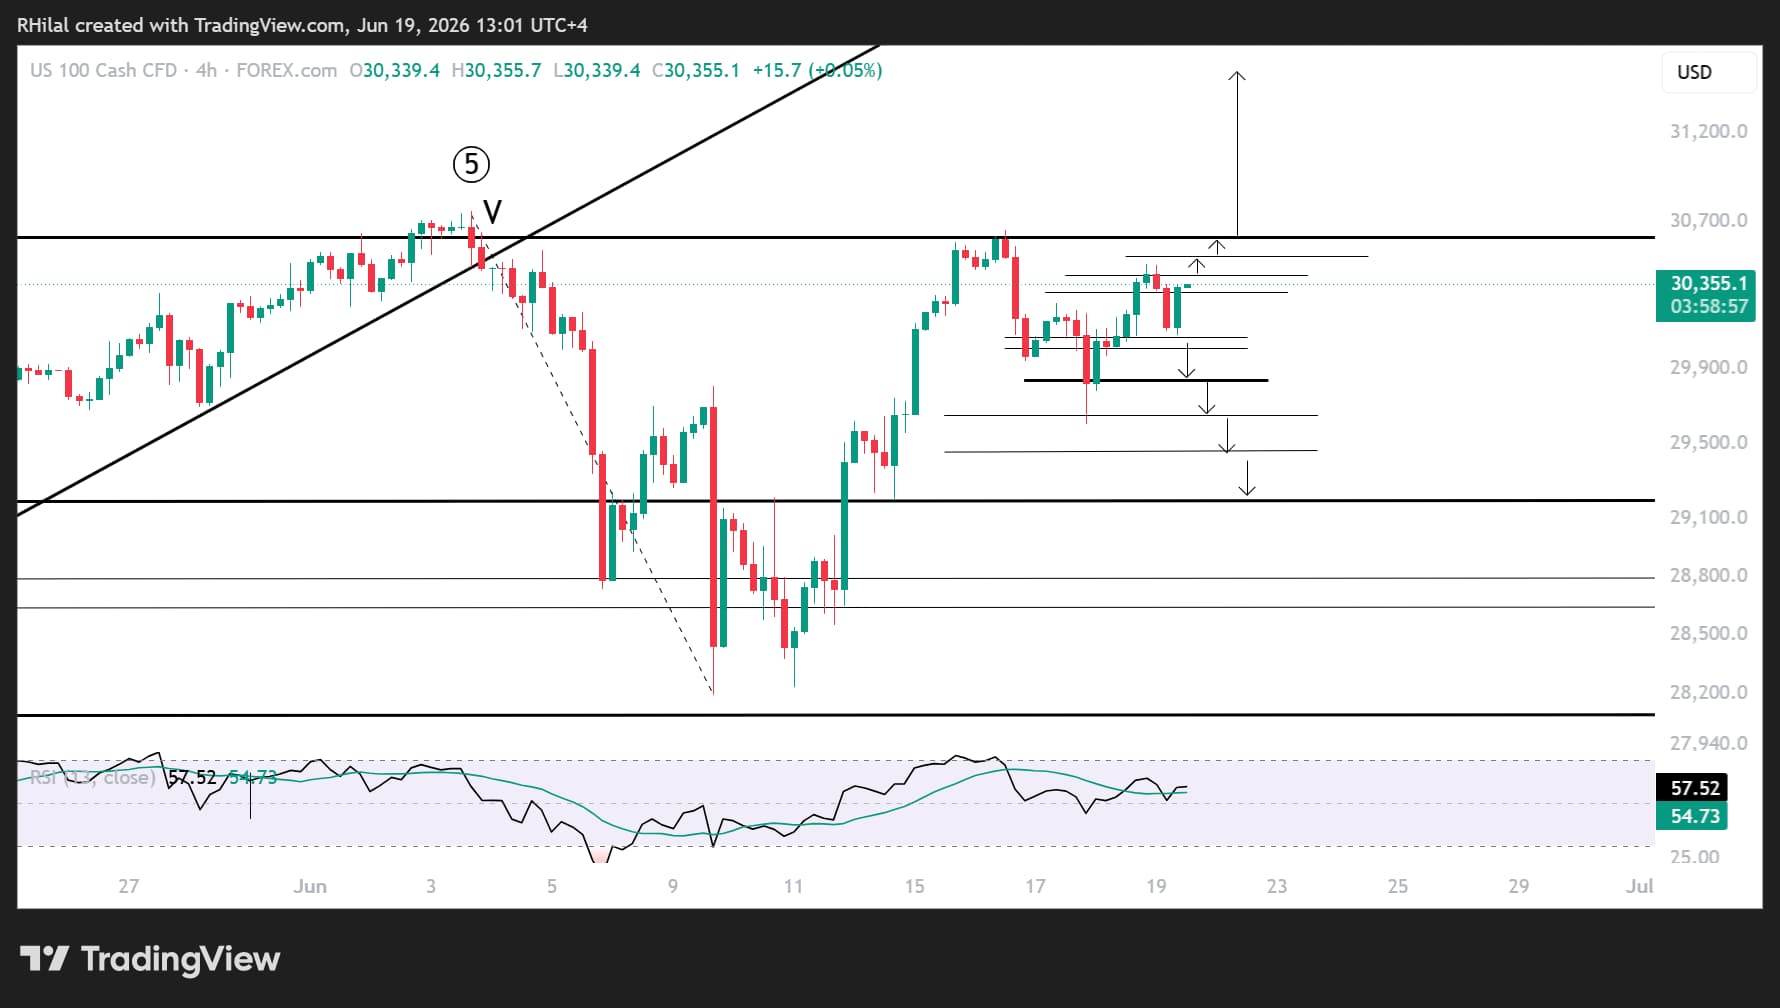
Dominant Framework: Nasdaq Remains in a Cautious Hold Above 30,000
The index continues to hold above the 29,600–30,000 support zone, emphasizing that buyers continue to defend this key area despite rising macroeconomic headwinds.
However, expectations for further gains remain uncertain given the evolving monetary policy and geopolitical landscape.
Bearish Scenario – Breakdown Below 29,600
A renewed breakdown below the 29,600–30,000 support zone, followed by a sustained move below 29,400, would reinforce bearish momentum.
Downside targets include:
- 29,140 - This level may serve as either a dip-buying zone or area where renewed selling pressure emerges towards 28600 - 28200
Momentum Still Supports the Bullish Case
The RSI continues to show signs of stabilization, attempting a bullish rebound above both its moving average and key resistance levels.
Momentum remains above the neutral 50 mark on both the daily and 4-hour timeframes, keeping the bullish scenario valid for now.
Bullish Scenario – Reclaiming 30,500
If bullish momentum returns and the Nasdaq successfully reclaims the 30,500 resistance zone, attention would shift toward the next record highs.
Such a move could trigger another 1,000-point advance toward the 31,500–31,700 region.
This target aligns with the 100% Fibonacci extension of the cycle spanning April 2025, January 2026, and March 2026.
A successful move into this region would reinforce the longer-term bullish trend and signal that investors remain willing to buy dips despite elevated valuations and tighter financial conditions.
DXY and Geopolitics Remain the Key Drivers
For now, both Bitcoin and the Nasdaq remain highly sensitive to shifts in monetary policy expectations and geopolitical developments.
With DXY testing fresh highs and rate hike expectations continuing to build, risk assets may remain vulnerable to another corrective phase unless key resistance levels are reclaimed in the sessions ahead.
The interaction between a stronger US dollar, rising bond yields, and renewed Middle East tensions will likely determine whether current pullbacks evolve into broader drawdowns or remain temporary corrections within longer-term bullish trends.
Written by Razan Hilal, CMT
Follow on X: @Rh_waves
Latest market news




The complete CFD trading experience
Award-winning platforms, competitive spreads, low commissions and dedicated support.
We live and breathe the markets and are dedicated to helping traders realise their ambitions as we continue to set the industry bar.
Economic calendar
Web Trader platform
Our sophisticated web-based platform is packed with features.
Related articles
EUR/USD, USD/JPY Outlook: Oil, yields and an FX identity crisis
Crude oil is setting the tone across rates and FX, leaving EUR/USD vulnerable and USD/JPY caught between higher Treasury yields and the growing threat of intervention

Nasdaq 100 Forecast: NDX falls as oil jumps and Treasury yields rise
U.S. stocks are pointing to a weaker open on Monday after President Trump rejected an Iranian ceasefire, sending oil prices higher and fuelling inflationary concerns and pushing Treasury yields higher.


Gold Dips Below Three-Month Uptrend, Bitcoin Pulls Back from Nine-Month High
Gold has dipped below its three-month uptrend, while Bitcoin has pulled back from a nine-month high as U.S. bond yields test levels last seen in 2004 and 2007. Risks build as Fed rate-hike expectations remain above 70%, while the Dollar Index holds near yearly highs.
StoneX Europe Ltd may make third party material available on this website which may contain information included but not limited to the conditions of financial markets. The material is for information purposes only and does not contain, and should not be construed as containing, investment advice and/or investment recommendation and/or an investment research and/or an offer of or solicitation for any transactions in financial instruments; any decision to enter into a specific transaction shall be made by the client following an assessment by him/her of their situation.
StoneX Europe Ltd makes no representation or warranty and assumes no liability as to the accuracy or completeness of the information provided, nor any loss arising from any investment based on a recommendation, forecast or other information supplied. You should always seek independent advice as to your suitability to speculate in any related markets and your ability to assume the associated risks, if you are at all unsure. We are not under any obligation to update any such material. Any opinion made may be personal to the author and may not reflect the opinion of StoneX Europe Ltd.