







Daily Forex Technical Trend Bias Key Levels Thurs 27 Jun
Mix USD performance where GBP/USD remains below resistance & further potential push up in USD/JPY and AUD/USD.
Share this:

EUR/USD – 1.1340 remains the key support to watch
click to enlarge chart
- Staged a minor push up from the 1.1340 key short-term pivotal support by 45 pips to print a high of 1.1391 in yesterday’s 26 Jun U.S. session before it traded sideways (click here for a recap). No change in key short-term elements, maintain bullish bias for a potential push up towards the next intermediate resistance at 1.1420.
- However, a break with an hourly close below 1.1340 invalidates the bullish scenario for a slide back towards the 1.1225/1180 support zone in the first step.
click to enlarge chart
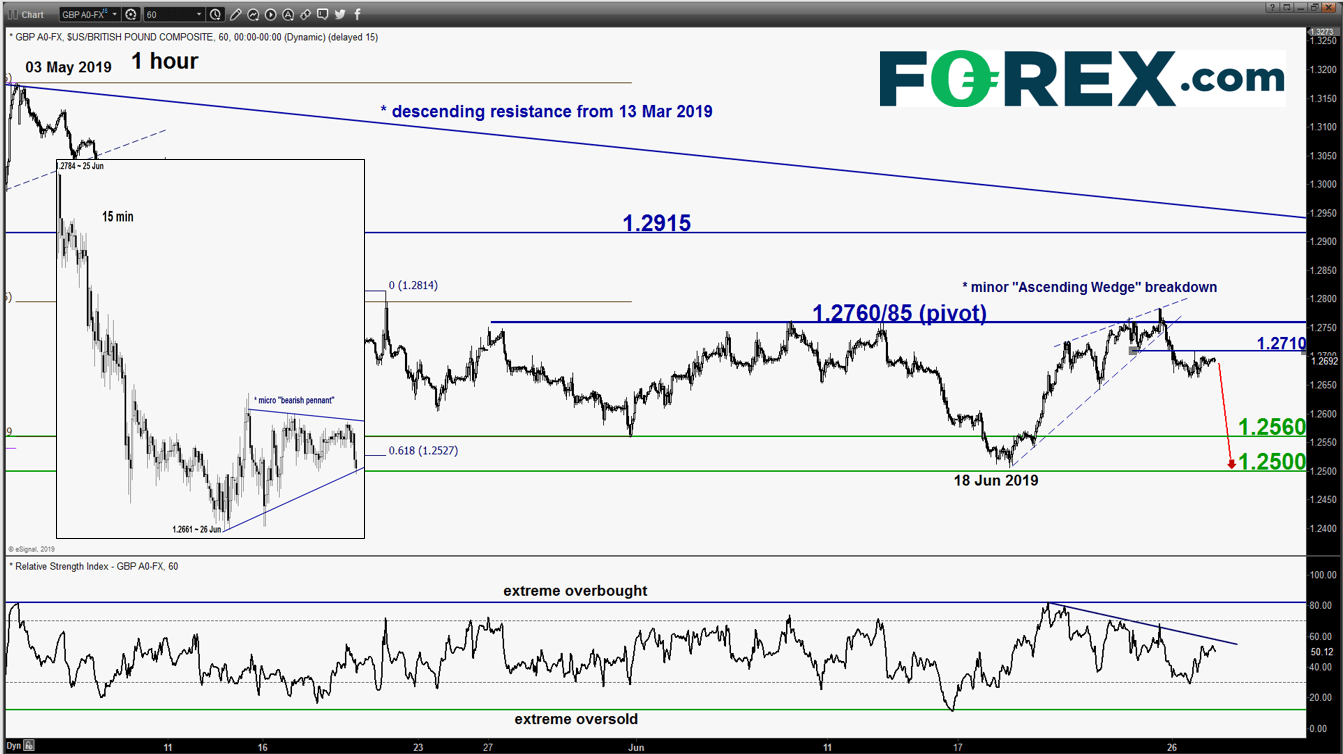
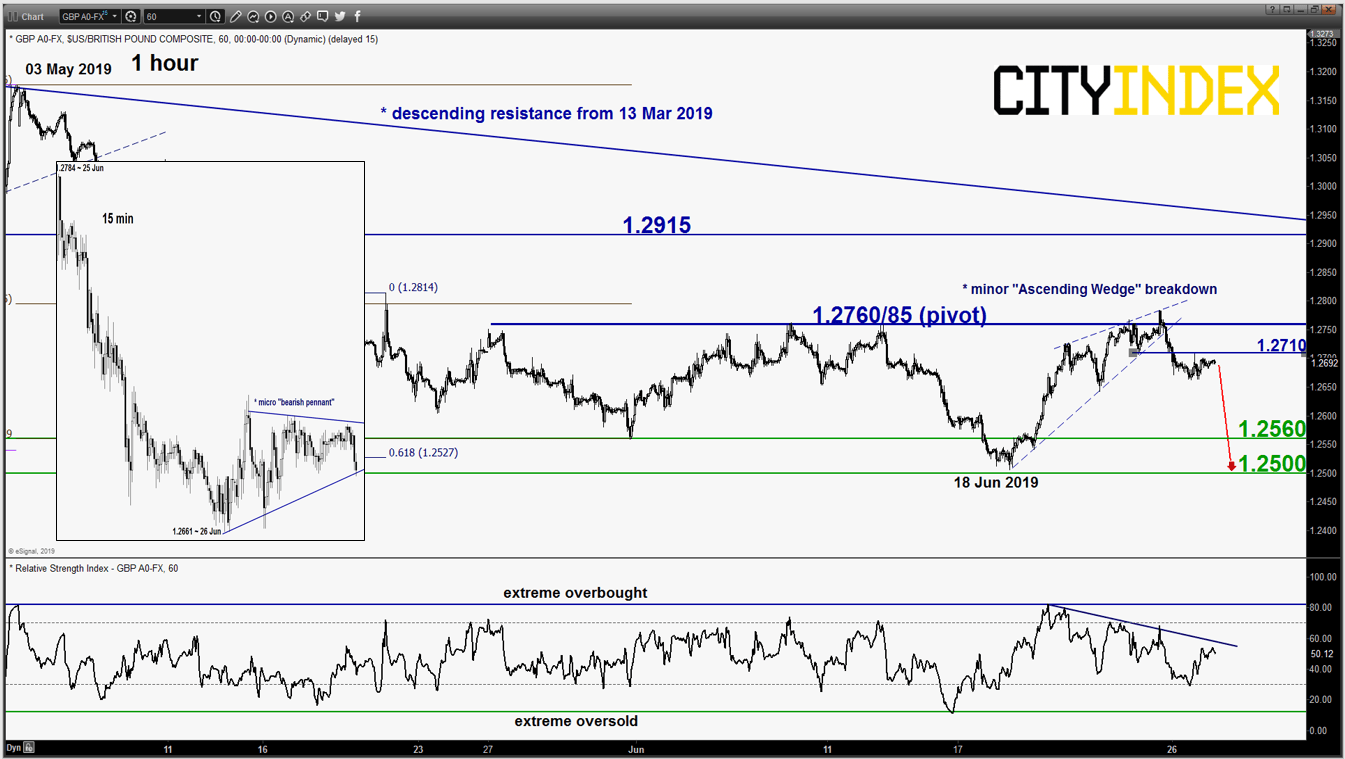
- Yesterday’s 26 Jun narrow price range of 47 pips has formed a micro “bearish pennant” configuration as seen on the 15-minute time frame. Maintain bearish bias below the 1.2760/2785 key short-term pivotal resistance for a further potential slide to retest the major support zone of 1.2560/2500 (the ascending trendline from Oct 2016 swing low).
- However, a break with an hourly close above 1.2760 sees an extension of the corrective rebound towards the next resistance at 1.2915 (also the descending trendline from 13 Mar 2019 high).
USD/JPY – Corrective rebound in progress
click to enlarge chart
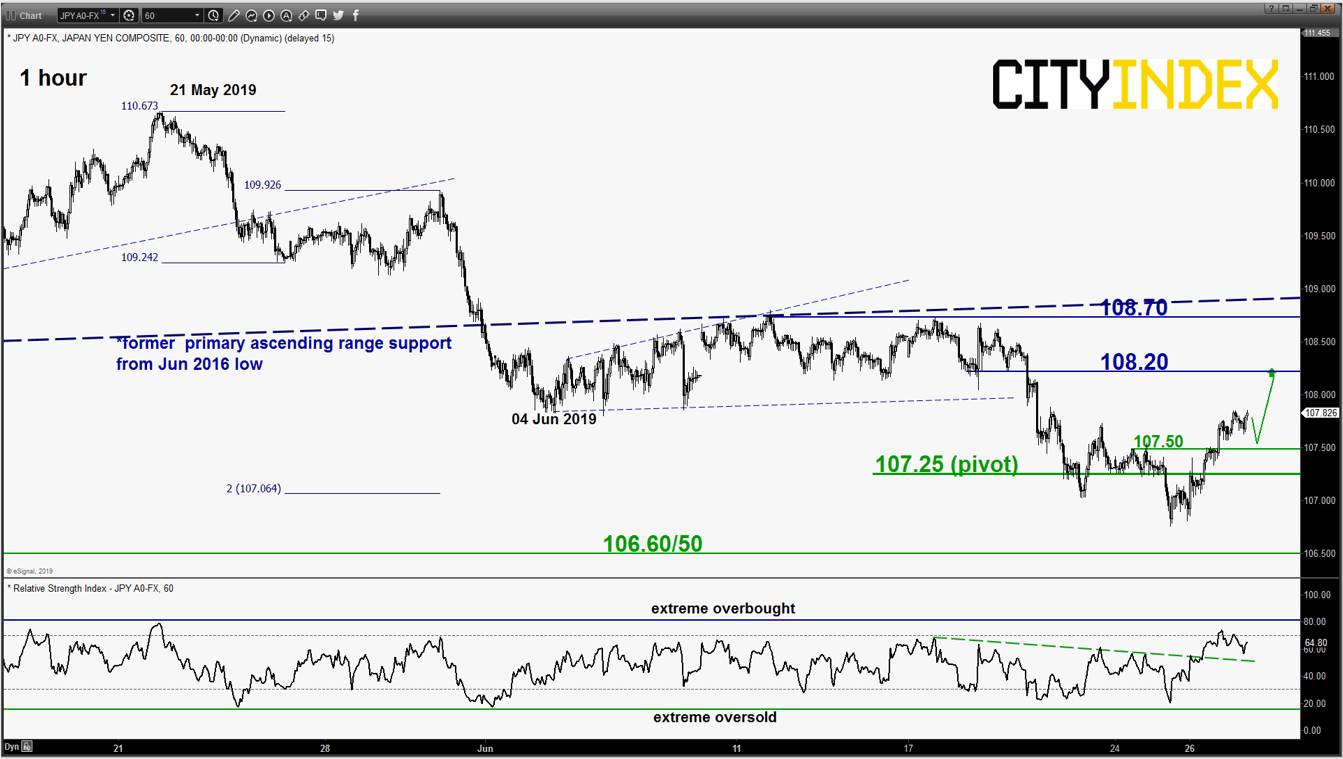
- Broke above the 107.55 upper limit of the short-term neutrality zone as per highlighted in our previous report. The corrective rebound scenario has been validated, bullish in any dips above the 107.25 key short-term pivotal support for a further potential push up to target the next intermediate resistance at 108.20 in the first step.
- However, an hourly close below 107.25 revives the bears for a downleg towards the next support at 106.60/50.
AUD/USD – Further push up towards 0.7050 key medium-term resistance
click to enlarge chart
- Continued to inch higher as expected. Maintain bullish bias with a tightened key short-term support now at 0.6970 for a further potential push towards 0.7020 follow by key medium-term resistance at 0.7050 (also a Fibonacci expansion/retracement cluster & the minor ascending channel resistance).
- However, a break with an hourly close below 0.6970 negates the bullish tone for a deeper pull-back towards the next near-term support at 0.6900 (also the 61.8% Fibonacci retracement of the on-going rebound from 18 Jun low to today, 27 Jun Asian session current intraday high of 0.6998).
Charts are from eSignal
EUR/USD – 1.1340 remains the key support to watch
click to enlarge chart
- Staged a minor push up from the 1.1340 key short-term pivotal support by 45 pips to print a high of 1.1391 in yesterday’s 26 Jun U.S. session before it traded sideways (click here for a recap). No change in key short-term elements, maintain bullish bias for a potential push up towards the next intermediate resistance at 1.1420.
- However, a break with an hourly close below 1.1340 invalidates the bullish scenario for a slide back towards the 1.1225/1180 support zone in the first step.
click to enlarge chart
- Yesterday’s 26 Jun narrow price range of 47 pips has formed a micro “bearish pennant” configuration as seen on the 15-minute time frame. Maintain bearish bias below the 1.2760/2785 key short-term pivotal resistance for a further potential slide to retest the major support zone of 1.2560/2500 (the ascending trendline from Oct 2016 swing low).
- However, a break with an hourly close above 1.2760 sees an extension of the corrective rebound towards the next resistance at 1.2915 (also the descending trendline from 13 Mar 2019 high).
USD/JPY – Corrective rebound in progress
click to enlarge chart
- Broke above the 107.55 upper limit of the short-term neutrality zone as per highlighted in our previous report. The corrective rebound scenario has been validated, bullish in any dips above the 107.25 key short-term pivotal support for a further potential push up to target the next intermediate resistance at 108.20 in the first step.
- However, an hourly close below 107.25 revives the bears for a downleg towards the next support at 106.60/50.
AUD/USD – Further push up towards 0.7050 key medium-term resistance
click to enlarge chart
- Continued to inch higher as expected. Maintain bullish bias with a tightened key short-term support now at 0.6970 for a further potential push towards 0.7020 follow by key medium-term resistance at 0.7050 (also a Fibonacci expansion/retracement cluster & the minor ascending channel resistance).
- However, a break with an hourly close below 0.6970 negates the bullish tone for a deeper pull-back towards the next near-term support at 0.6900 (also the 61.8% Fibonacci retracement of the on-going rebound from 18 Jun low to today, 27 Jun Asian session current intraday high of 0.6998).
Charts are from eSignal


The complete CFD trading experience
Award-winning platforms, competitive spreads, low commissions and dedicated support.
We live and breathe the markets and are dedicated to helping traders realise their ambitions as we continue to set the industry bar.
Economic calendar
Web Trader platform
Our sophisticated web-based platform is packed with features.
Related articles
Japanese Yen Forecast: USD/JPY 4% Rally Challenges Post-Intervention Downtrend 9 24 2026
USD/JPY momentum has shifted sharply higher, putting a major resistance confluence in focus as U.S. and Japanese event risk builds.

Oil Quietly Hands the Fed a Reason to Stay Hawkish
Oil prices and the U.S. dollar are both on the front foot as elevated energy costs feed Fed warnings that inflation may prove sticky.


USD/JPY outlook: Hawkish Fed recalibration pressures the yen
Stronger US growth momentum and rising Treasury yields are keeping USD/JPY pointed higher, even as Japanese policymakers try to limit the pressure building across domestic markets.

StoneX Europe Ltd may make third party material available on this website which may contain information included but not limited to the conditions of financial markets. The material is for information purposes only and does not contain, and should not be construed as containing, investment advice and/or investment recommendation and/or an investment research and/or an offer of or solicitation for any transactions in financial instruments; any decision to enter into a specific transaction shall be made by the client following an assessment by him/her of their situation.
StoneX Europe Ltd makes no representation or warranty and assumes no liability as to the accuracy or completeness of the information provided, nor any loss arising from any investment based on a recommendation, forecast or other information supplied. You should always seek independent advice as to your suitability to speculate in any related markets and your ability to assume the associated risks, if you are at all unsure. We are not under any obligation to update any such material. Any opinion made may be personal to the author and may not reflect the opinion of StoneX Europe Ltd.