







Dont Forget about China GDP
A decrease in GDP may show some additional dents in the armor of China’s economy
Share this:

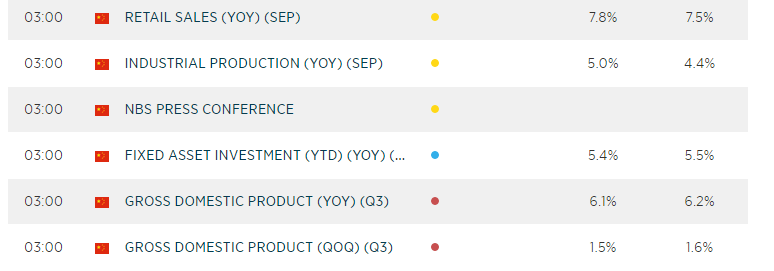
While the world waits on pins and needles for Parliament to vote on Brexit in the UK on Saturday, there is some major data left on the Economic Calendar during Asian hours which may turn some heads:
Source: City Index
In particular, we need to look at Chinese GDP (YoY) for Q3, which is expected to be 6.1% vs 6.2% last. A decrease in GDP may show some additional dents in the armor of China’s economy and, in all likelihood, that the tariffs placed on China’s goods are feeding through to the real economy. And while the White House has recognized that Phase One of the US-China trade deal only needs to be signed, China suggests that there is still a lot of work to be done. There will likely be additional comments out of China regarding the situation.
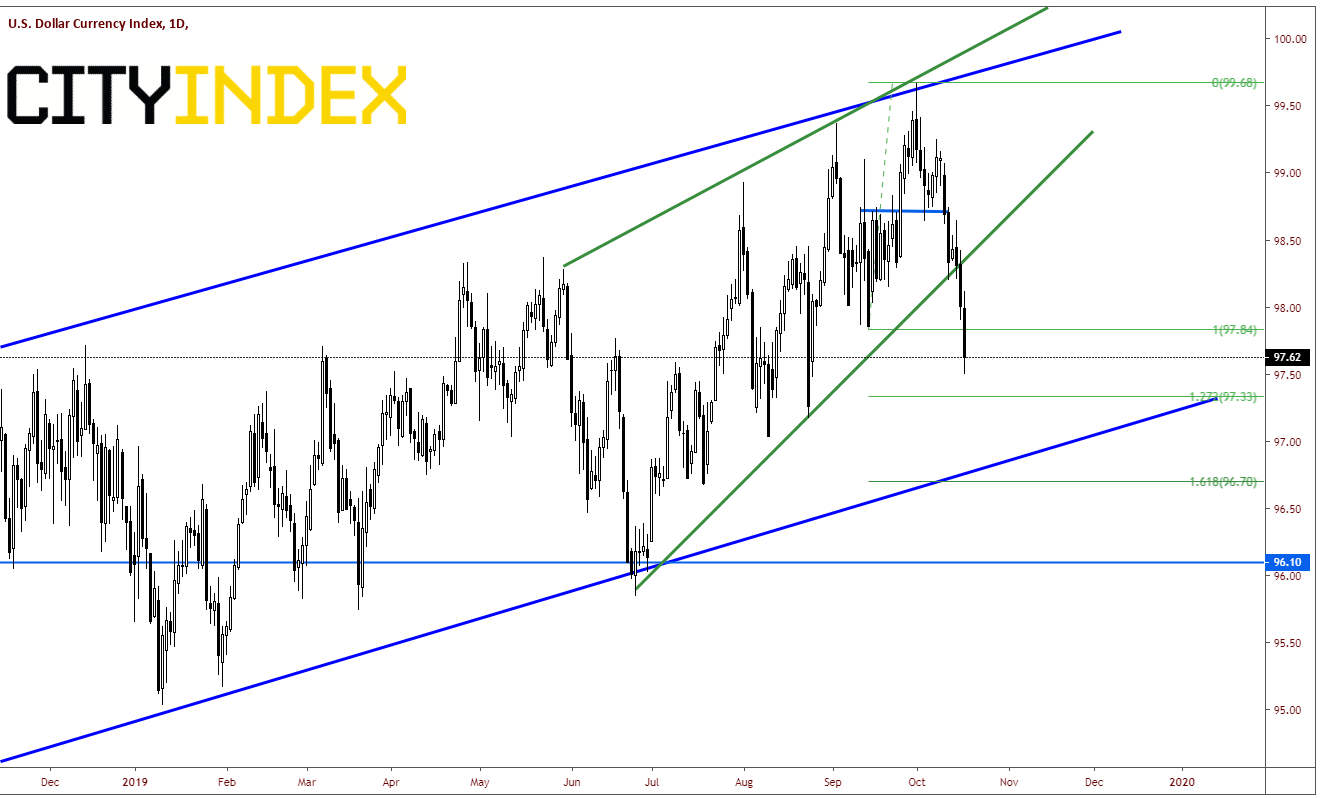
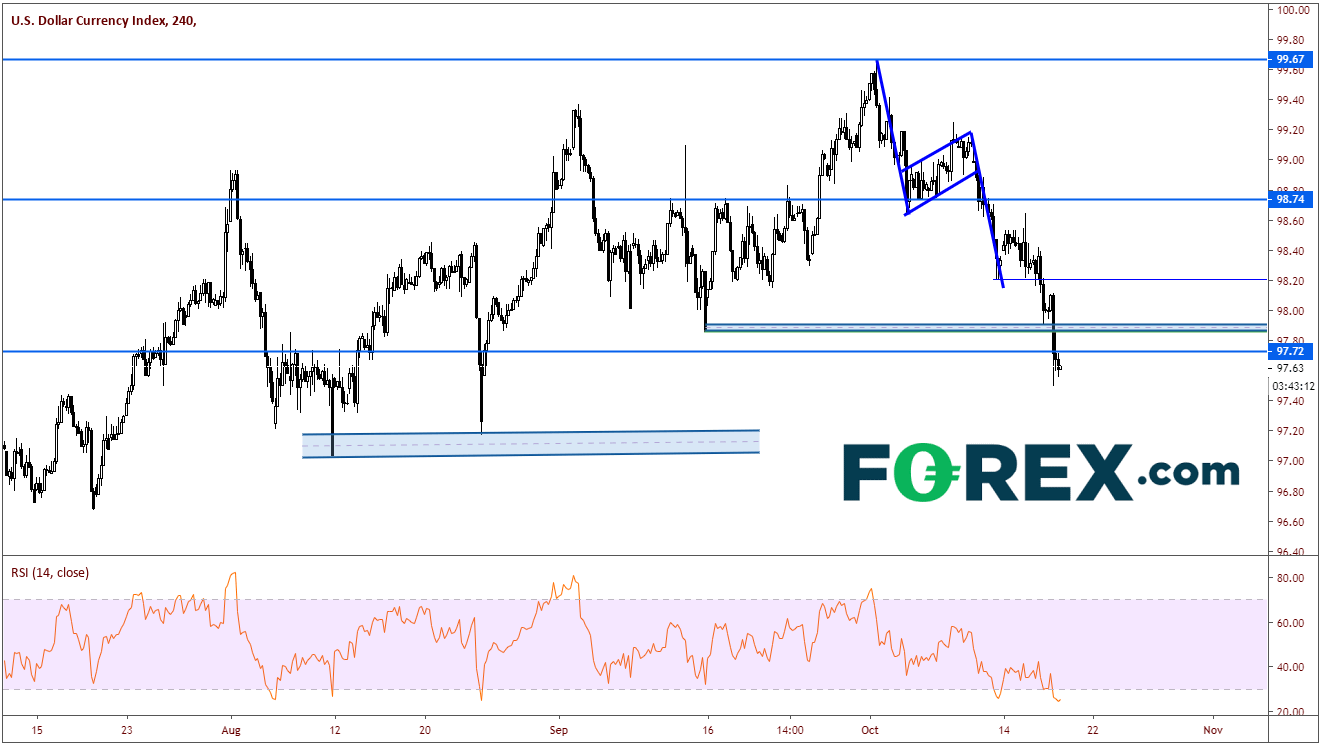
For now, DXY is pushing lower of the euphoria of both the Euro and Sterling on the back of a potential Brexit deal. DXY is currently made up of 57.6% of the Euro and 11.9% GBP. Therefore, the DXY direction is heavily influenced by the direction of these two pairs. After breaking down from the rising wedge, the DXY continues to push lower today. Levels to take note of on the downside are the 127.2% Fibonacci extension of the move from the low on June 25th to the high on October 1st which is 97.33. The rising trendline from the bottom of the channel and the 161.8% Fibonacci retracement level from the previously mentioned timeframe is near 96.70. On a 240-minute chart, there is resistance above at the 97.85/97.90 level, and then horizonal resistance near 98.75. Also note that the RSI on the 240-minute has moved into oversold territory, an indication that a bounce may be ahead.
Source: Tradingview, City Index
Source: Tradingview, City Index
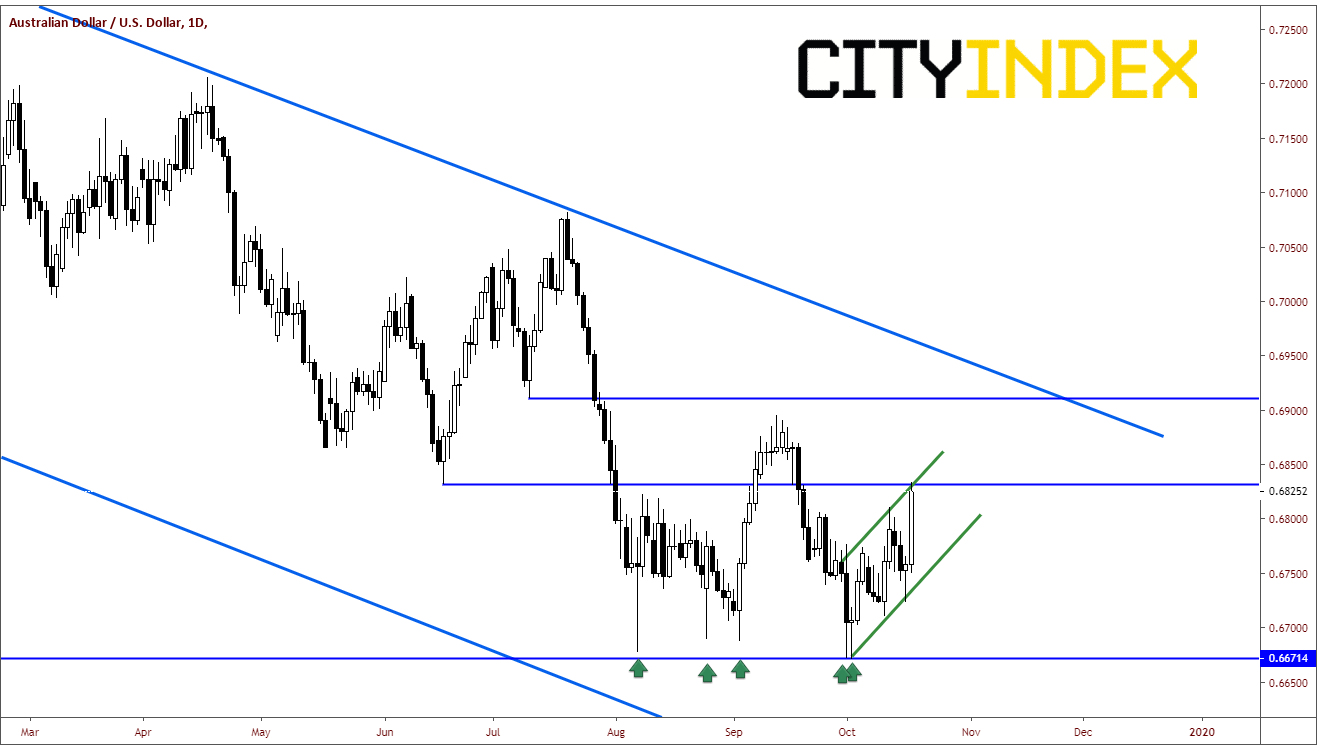
With the move lower in the DXY, AUD and NZD got a head start on the GDP data release tonight. AUD/USD is currently up 1% and running into both trendline and horizontal resistance at .6825. With a stronger unemployment rate earlier, stronger GDP out of China may push it higher to near .6900. I miss in the data could push AUD/USD towards the bottom end of the channel near .6750.
Source: Tradingview, City Index
NZD/USD is higher on the day as well, as the pair is trying to forge its way through an inverted head and shoulders pattern. If Chinese GDP is stronger, NZD/USD can move towards horizontal resistance and the target for the inverted head and shoulders pattern at .6485/.6500. (To get the target for an inverted head and shoulders pattern, take the distance from the neckline to head of the pattern and add it to the breakout of the neckline.) A miss in GDP could push price lower, and possibly even negate the inverse head and shoulders pattern.
Source: Tradingview, City Index
While the world waits on pins and needles for Parliament to vote on Brexit in the UK on Saturday, there is some major data left on the Economic Calendar during Asian hours which may turn some heads:
Source: FOREX.com
In particular, we need to look at Chinese GDP (YoY) for Q3, which is expected to be 6.1% vs 6.2% last. A decrease in GDP may show some additional dents in the armor of China’s economy and, in all likelihood, that the tariffs placed on China’s goods are feeding through to the real economy. And while the White House has recognized that Phase One of the US-China trade deal only needs to be signed, China suggests that there is still a lot of work to be done. There will likely be additional comments out of China regarding the situation.
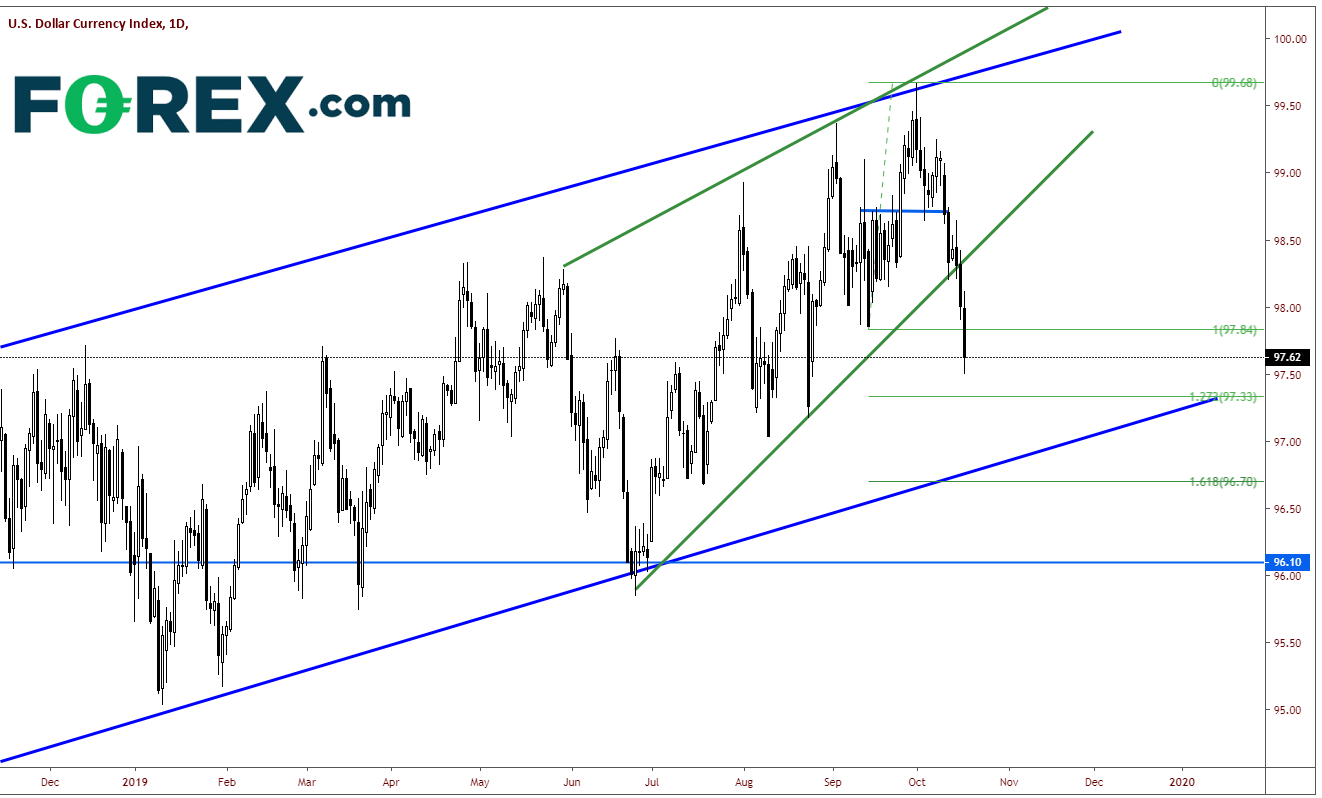
For now, DXY is pushing lower of the euphoria of both the Euro and Sterling on the back of a potential Brexit deal. DXY is currently made up of 57.6% of the Euro and 11.9% GBP. Therefore, the DXY direction is heavily influenced by the direction of these two pairs. After breaking down from the rising wedge, the DXY continues to push lower today. Levels to take note of on the downside are the 127.2% Fibonacci extension of the move from the low on June 25th to the high on October 1st which is 97.33. The rising trendline from the bottom of the channel and the 161.8% Fibonacci retracement level from the previously mentioned timeframe is near 96.70. On a 240-minute chart, there is resistance above at the 97.85/97.90 level, and then horizonal resistance near 98.75. Also note that the RSI on the 240-minute has moved into oversold territory, an indication that a bounce may be ahead.
Source: Tradingview, Forex.com
Source: Tradingview, Forex.com
With the move lower in the DXY, AUD and NZD got a head start on the GDP data release tonight. AUD/USD is currently up 1% and running into both trendline and horizontal resistance at .6825. With a stronger unemployment rate earlier, stronger GDP out of China may push it higher to near .6900. I miss in the data could push AUD/USD towards the bottom end of the channel near .6750.
Source: Tradingview, Forex.com
NZD/USD is higher on the day as well, as the pair is trying to forge its way through an inverted head and shoulders pattern. If Chinese GDP is stronger, NZD/USD can move towards horizontal resistance and the target for the inverted head and shoulders pattern at .6485/.6500. (To get the target for an inverted head and shoulders pattern, take the distance from the neckline to head of the pattern and add it to the breakout of the neckline.) A miss in GDP could push price lower, and possibly even negate the inverse head and shoulders pattern.
Source: Tradingview, Forex.com


The complete CFD trading experience
Award-winning platforms, competitive spreads, low commissions and dedicated support.
We live and breathe the markets and are dedicated to helping traders realise their ambitions as we continue to set the industry bar.
Economic calendar
Web Trader platform
Our sophisticated web-based platform is packed with features.
Related articles
Japanese Yen Forecast: USD/JPY 4% Rally Challenges Post-Intervention Downtrend 9 24 2026
USD/JPY momentum has shifted sharply higher, putting a major resistance confluence in focus as U.S. and Japanese event risk builds.

Oil Quietly Hands the Fed a Reason to Stay Hawkish
Oil prices and the U.S. dollar are both on the front foot as elevated energy costs feed Fed warnings that inflation may prove sticky.


USD/JPY outlook: Hawkish Fed recalibration pressures the yen
Stronger US growth momentum and rising Treasury yields are keeping USD/JPY pointed higher, even as Japanese policymakers try to limit the pressure building across domestic markets.

StoneX Europe Ltd may make third party material available on this website which may contain information included but not limited to the conditions of financial markets. The material is for information purposes only and does not contain, and should not be construed as containing, investment advice and/or investment recommendation and/or an investment research and/or an offer of or solicitation for any transactions in financial instruments; any decision to enter into a specific transaction shall be made by the client following an assessment by him/her of their situation.
StoneX Europe Ltd makes no representation or warranty and assumes no liability as to the accuracy or completeness of the information provided, nor any loss arising from any investment based on a recommendation, forecast or other information supplied. You should always seek independent advice as to your suitability to speculate in any related markets and your ability to assume the associated risks, if you are at all unsure. We are not under any obligation to update any such material. Any opinion made may be personal to the author and may not reflect the opinion of StoneX Europe Ltd.