



ETH/USD outlook: Bears press as bulls cling to support
Uptrend support has buckled, momentum is bearish, yet a wedge pattern keeps hope alive for longer-term ETH bulls. $3715 is the level to watch near-term.
Share this:

- Uptrend break signals possible shifting directional risks
- $3715 support key for near-term price action
- Momentum signals favor bearish setups
- Falling wedge hints at longer-term bullish risk
Summary
ETH/USD is at a crossroads, with short-term momentum pointing lower while a falling wedge pattern suggests longer-term upside potential. Price action around $3715 may prove instructive, offering setups for both bears and bulls as the market decides its next move.
ETH/USD Bearish Unwind Stalls
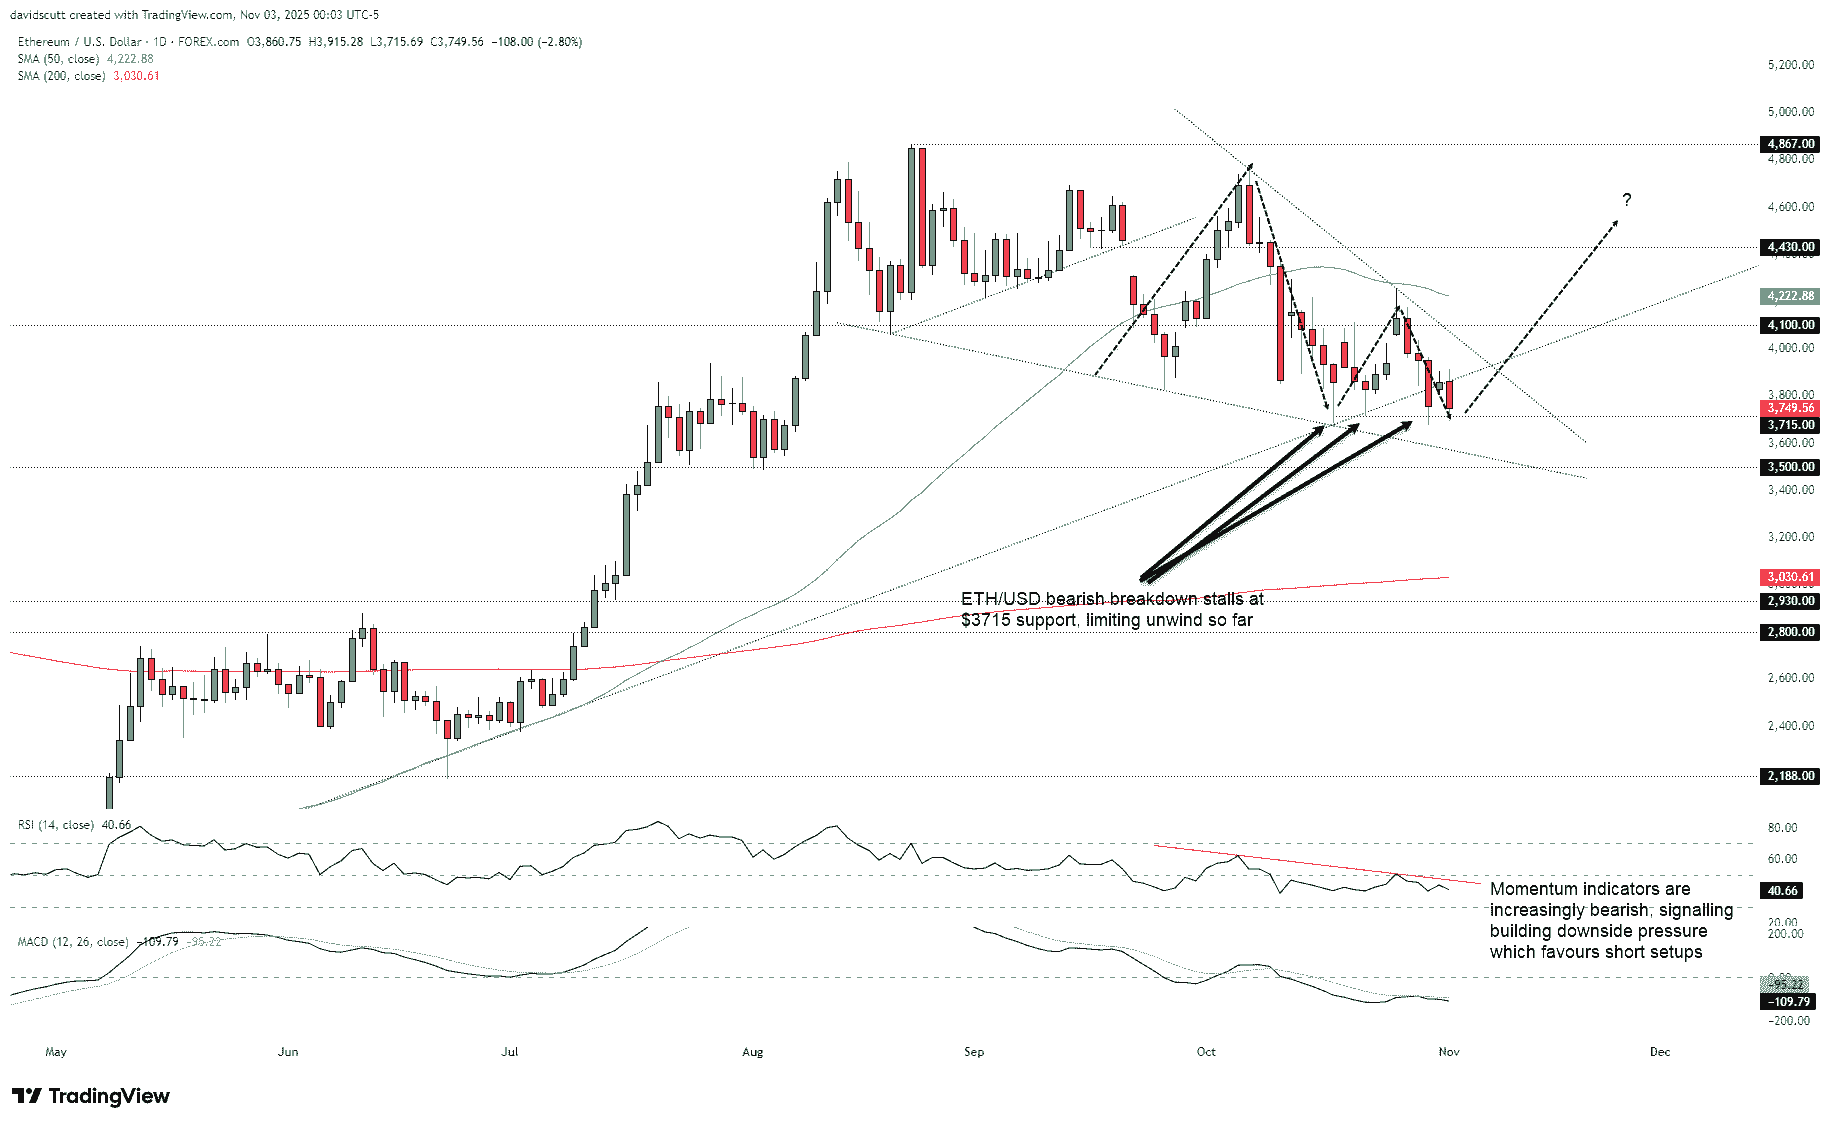
Right now, ETH/USD is testing $3715, a level where the price bounced on three occasions last month. Continuing the form of October, the first test we’ve seen in November has resulted in a similar move, limiting downside despite the bearish break of long-running uptrend support from the April lows last week. As such, near-term price action around $3715 may prove instructive on longer-term directional risks for ETH/USD.
Source: TradingView
If the price were to break and close beneath $3715, it would create a potential short setup where positions could be established below with a stop above for protection, targeting either downtrend support beneath $3600 or support at $3500. Given the break of uptrend support and increasingly bearish picture from RSI (14) and MACD, which continue to push lower indicating strengthening downside pressure, the preference remains to sell into strength given the backdrop.
However, if the price were to continue bouncing off $3715, it would open the door for a possible countertrend trade, allowing for longs to be established above with a stop below to protect against a resumption of the bearish trend. ETH/USD ran into sellers at $3900 earlier today, as was the case last Friday. It therefore screens as a logical initial target, with $4100 another given the amount of price action either side of it over recent weeks.
Regardless of whether we see downside or upside from here, it’s notable that when you zoom out on the price action, ETH/USD sits in a falling wedge pattern, hinting that if we see an eventual bullish breakout of the downtrend from the high set on October 7, it may spark an eventual return to the record high of $4867 set in August. There’s a lot of water still to go under the bridge before we see that possible outcome, but it’s something to keep in the back of your mind when assessing the price action over the coming weeks.
Related tags:



The complete CFD trading experience
Award-winning platforms, competitive spreads, low commissions and dedicated support.
We live and breathe the markets and are dedicated to helping traders realise their ambitions as we continue to set the industry bar.
Economic calendar
Web Trader platform
Our sophisticated web-based platform is packed with features.
Related articles
Dow Jones forecast: Stock markets under pressure from multiple sources
When looking at the major tech-heavy US indices like the S&P 500 or the Nasdaq 100, you wouldn’t think that the stock market is particularly weak. Yet, beneath the surface, the market is far from healthy right now. Investors are evidently just piling into the big tech and AI names, and as a result, market breadth is deteriorating. Other indices like the small cap Russell 2000 and the Dow Jones are starting to reflect that weakness.

Nikkei breakout accelerates as yen weakness returns
Nikkei has started October with a powerful breakout, helped by renewed yen weakness and strong upside momentum

The RBA Hiked Rates and the Australian Dollar Still Fell
AUD/USD fell after the RBA rate hike because the central bank's hawkish stance was already priced in while the U.S. dollar stayed firm.
StoneX Europe Ltd may make third party material available on this website which may contain information included but not limited to the conditions of financial markets. The material is for information purposes only and does not contain, and should not be construed as containing, investment advice and/or investment recommendation and/or an investment research and/or an offer of or solicitation for any transactions in financial instruments; any decision to enter into a specific transaction shall be made by the client following an assessment by him/her of their situation.
StoneX Europe Ltd makes no representation or warranty and assumes no liability as to the accuracy or completeness of the information provided, nor any loss arising from any investment based on a recommendation, forecast or other information supplied. You should always seek independent advice as to your suitability to speculate in any related markets and your ability to assume the associated risks, if you are at all unsure. We are not under any obligation to update any such material. Any opinion made may be personal to the author and may not reflect the opinion of StoneX Europe Ltd.