




Euro Stoxx 50 rebound faces significant hurdles
European equity markets extend their rebound for a second day amid tentative signs that virus cases slow in Europe. However, charts show a less rosy picture...
Share this:

European equity markets extend their rebound for a second day amid tentative signs that virus cases slow in Europe. However, charts show a less rosy picture as European indices face significant hurdles.
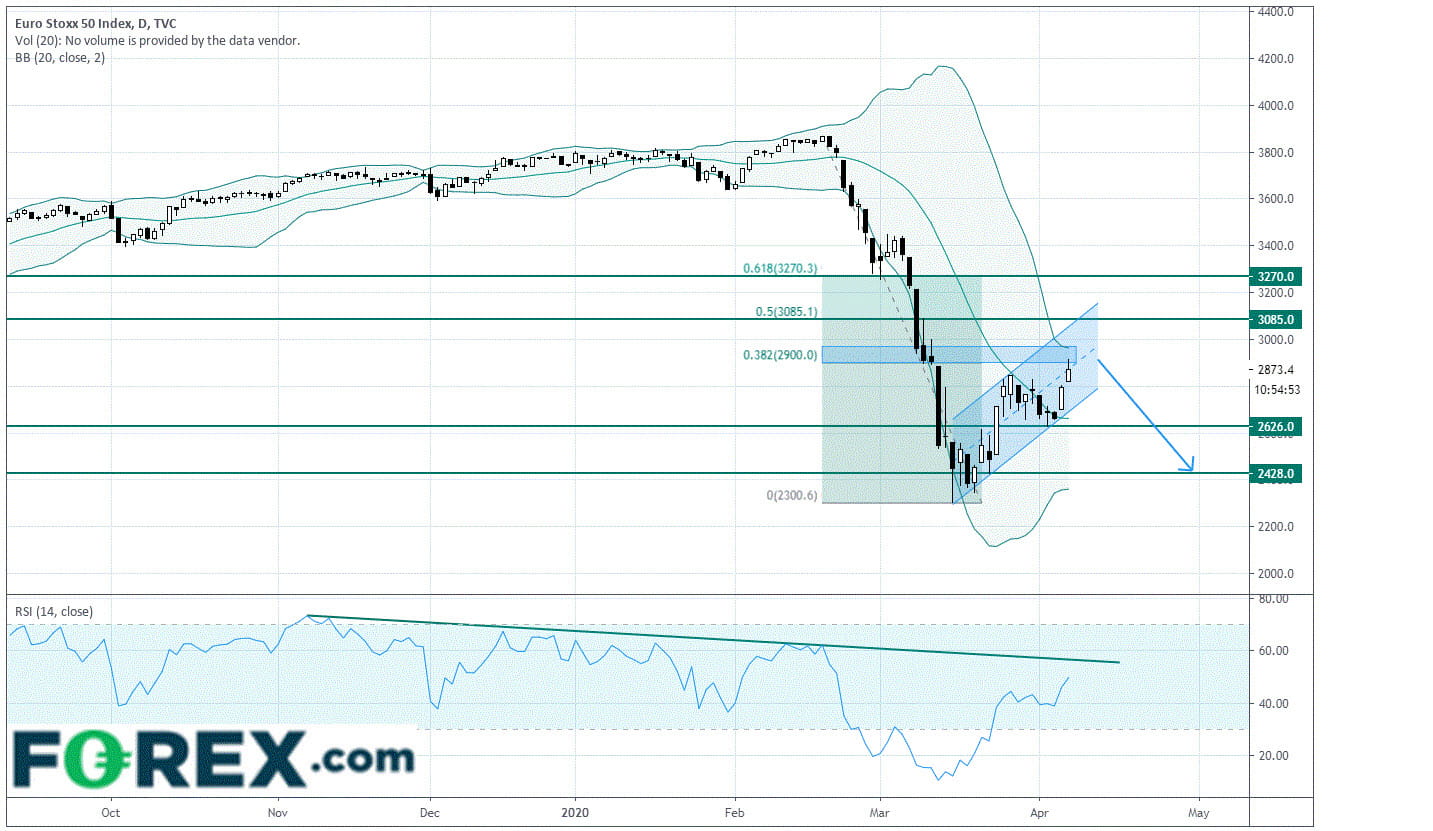
From a technical perspective, the index of European blue-chip companies - the Euro Stoxx 50 - is posting a rebound thanks to the upside breakout of the declining 20-day simple moving average which was playing a resistance role since March 26th intermediary top.
The index price is now approaching from the resistance zone between 2900 and 3085 (respectively the 38.2% and 50% Fibonacci retracement level of the February 20th to March 16th down move). In addition, prices are nearing both the upper Bollinger boundary on a daily chart and the 2018 low which could play a resistance role according to polarity principle.
Regarding technical indicators, the Relative Strength Index (RSI, 14) is reversing up from its oversold territory but remains capped by a declining trend line. As a consequence, readers may want to consider the potential for short trades below the resistance zone 2900 - 3085 with the horizontal support at 2626 as target. Caution: a break below 2626 would open the way to a further decline towards 2428.
Alternatively, a push above the resistance zone 2900 - 3085 would call for a continuation of the rise towards the next resistance at 3270.
Source: TradingView, GAIN Capital
European equity markets extend their rebound for a second day amid tentative signs that virus cases slow in Europe. However, charts show a less rosy picture as European indices face significant hurdles.
From a technical perspective, the index of European blue-chip companies - the Euro Stoxx 50 - is posting a rebound thanks to the upside breakout of the declining 20-day simple moving average which was playing a resistance role since March 26th intermediary top.
The index price is now approaching from the resistance zone between 2900 and 3085 (respectively the 38.2% and 50% Fibonacci retracement level of the February 20th to March 16th down move). In addition, prices are nearing both the upper Bollinger boundary on a daily chart and the 2018 low which could play a resistance role according to polarity principle.
Regarding technical indicators, the Relative Strength Index (RSI, 14) is reversing up from its oversold territory but remains capped by a declining trend line. As a consequence, readers may want to consider the potential for short trades below the resistance zone 2900 - 3085 with the horizontal support at 2626 as target. Caution: a break below 2626 would open the way to a further decline towards 2428.
Alternatively, a push above the resistance zone 2900 - 3085 would call for a continuation of the rise towards the next resistance at 3270.
Source: TradingView, GAIN Capital
Related tags:
Latest market news




The complete CFD trading experience
Award-winning platforms, competitive spreads, low commissions and dedicated support.
We live and breathe the markets and are dedicated to helping traders realise their ambitions as we continue to set the industry bar.
Economic calendar
Web Trader platform
Our sophisticated web-based platform is packed with features.
Related articles

S&P 500 forecast: Stocks extend drop as correction risks grow
US and global equity markets have extended Wednesday’s sell-off, with Wall Street opening lower after a weak handover from Asia and Europe. The deterioration in risk appetite has been spreading across global markets. The dollar was firmer, Treasury yields were holding onto yesterday’s gains, while gold, silver and bitcoin were all under pressure alongside equities and major currencies.

Bitcoin Analysis: Are Buyers Back in Control?
The latest trading sessions have been particularly relevant when looking at the strength of demand surrounding Bitcoin. This can be seen in recent price action, as BTC has gained more than 13% over the last five trading sessions, bringing a meaningful bullish bias back into focus in the short term.


Nikkei threatens breakout as tech rebound broadens
Breakouts across the SOX and Nasdaq are being matched by rebounds across Asia, with the Nikkei now threatening to join the move.

StoneX Europe Ltd may make third party material available on this website which may contain information included but not limited to the conditions of financial markets. The material is for information purposes only and does not contain, and should not be construed as containing, investment advice and/or investment recommendation and/or an investment research and/or an offer of or solicitation for any transactions in financial instruments; any decision to enter into a specific transaction shall be made by the client following an assessment by him/her of their situation.
StoneX Europe Ltd makes no representation or warranty and assumes no liability as to the accuracy or completeness of the information provided, nor any loss arising from any investment based on a recommendation, forecast or other information supplied. You should always seek independent advice as to your suitability to speculate in any related markets and your ability to assume the associated risks, if you are at all unsure. We are not under any obligation to update any such material. Any opinion made may be personal to the author and may not reflect the opinion of StoneX Europe Ltd.