




Nikkei threatens breakout as tech rebound broadens
Breakouts across the SOX and Nasdaq are being matched by rebounds across Asia, with the Nikkei now threatening to join the move.
Share this:

- SOX and Nasdaq break higher as tech sentiment broadens
- KOSPI and SOX lead rebounds from August lows
- Nikkei tests 66,800 with momentum indicators turning bullish
Whether you’re talking the SOX index in the United States, the broader Nasdaq, or an increasing number of other tech-related indices, the bulls are clearly starting to stir, with breakout after breakout after breakout seen over the past couple of days.
Regardless of whether you’re talking about the upstream nuts and bolts of the AI build-out or the lower-beta end of the market dominated by the hyperscalers, all are starting to come back to life, albeit from very different levels.
SOX breaks first, Nasdaq follows
Source: TradingView
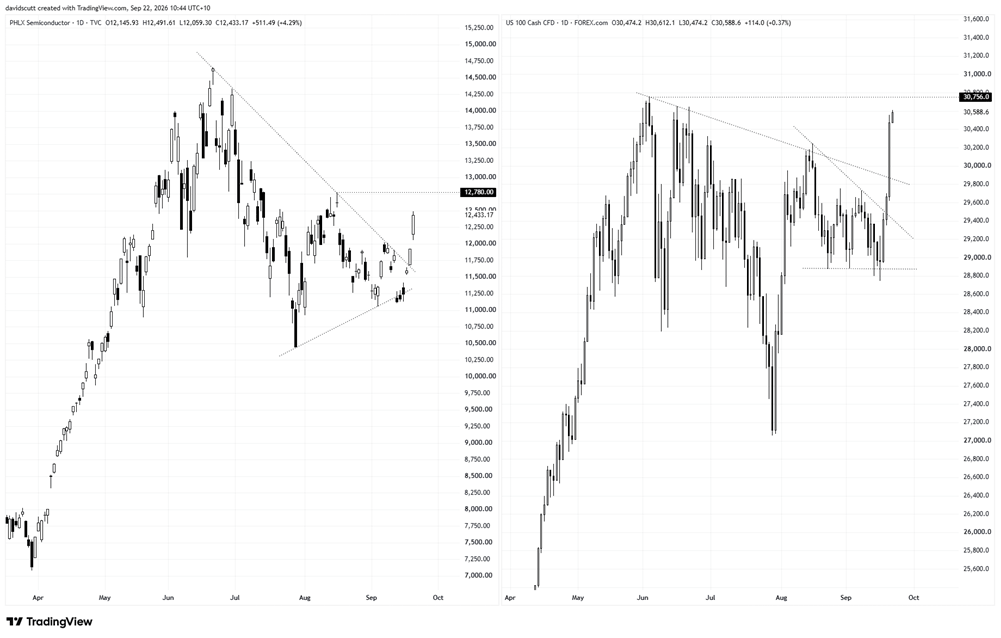
As you can see in the side-by-side chart above, we saw a strong breakout through downtrend resistance in the SOX on Friday. Lo and behold, Nasdaq futures have started the new week by ramping higher as well, with the record highs now back in sight.
It’s not just the US tech darlings feeling the love, with the dominant tech players in Asia also showing signs of rebounding strongly after copping the full heat of the drawdown earlier this year.
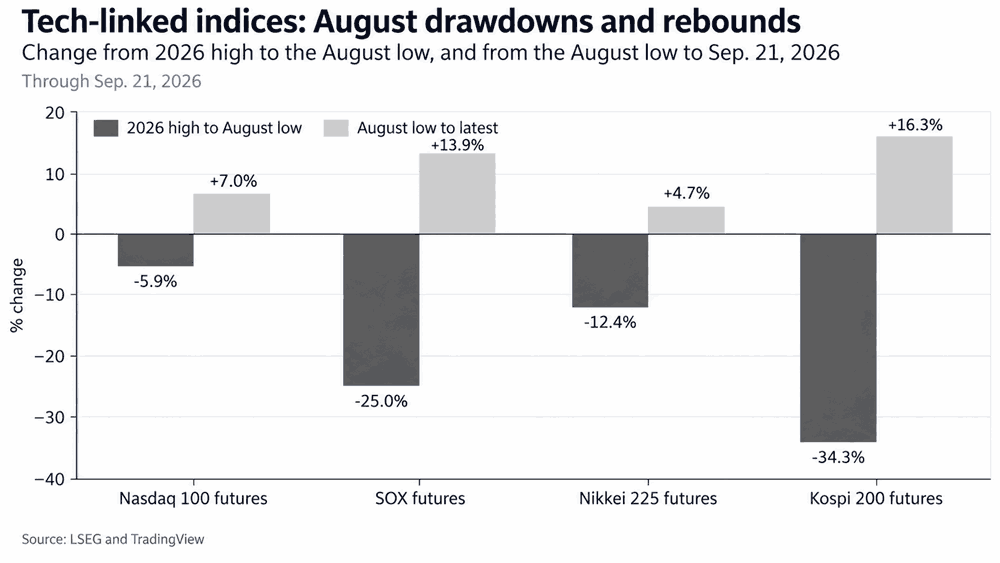
From the recent August lows, the rebound has been strongest in some of the markets that were hit hardest. KOSPI 200 futures have recovered 16.3%, SOX futures 13.9%, Nasdaq 100 futures 7%, and Nikkei futures 4.7%.
Source: LSEG, TradingView
While the Nikkei has lagged the overall move, don’t assume that means it has to play catch-up. Instead, what it demonstrates is that we’re seeing the rebound broaden, spanning everything from the semis to the large-cap US tech names.
Technicals explain plenty
While company-specific narratives have been plentiful as justification for the bullish turn, with Meta’s Muse topping Apple’s app download charts the latest apparent catalyst to spark a wave of bullish sentiment, you wouldn’t need any of that information if you were looking solely at the charts. Technicals explain plenty!
Then throw in what’s been happening with crude, with movements in oil demonstrating the ability to shift broader sentiment across rates, currencies and equities, regardless of whether some of those relationships are bordering on the spurious and then some.
Semis and the broader US tech complex don’t appear to be any exception, adding another bullish dimension to the price action we’ve seen over the past couple of sessions.
With both semis and the broader US tech complex breaking higher within a matter of sessions, attention now falls on similar markets yet to fully join the move.
The Nikkei looks like it could be the next domino to fall.
Nikkei probes stubborn resistance
Source: TradingView
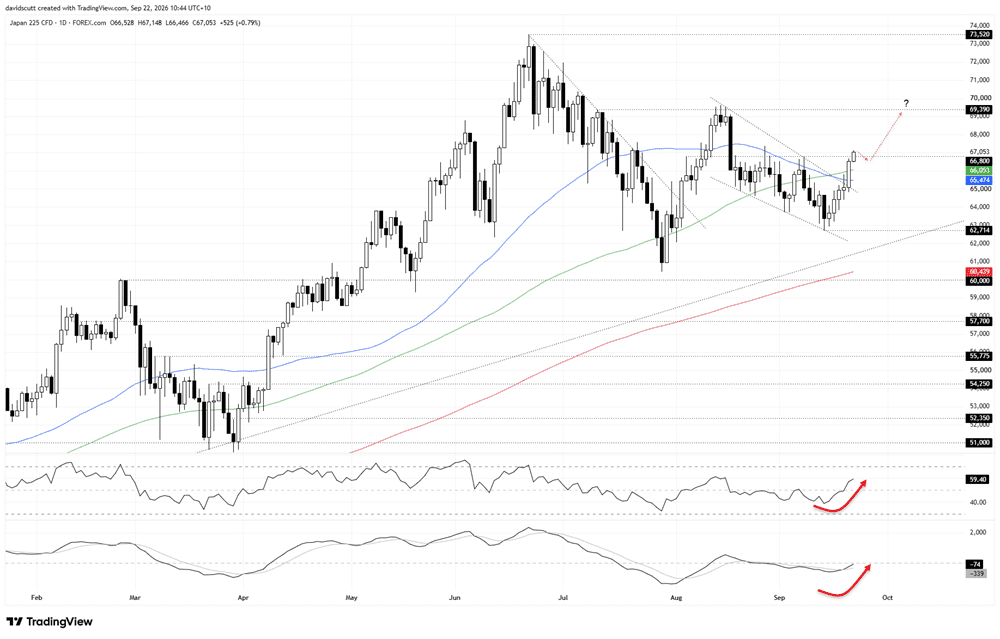
The index broke the falling wedge it had been coiling in for well over a month on Monday, pushing through both the 50 and 100-day moving averages before stalling at 66,800, a resistance level that capped the price for lengthy periods in August and early September.
While we’ve seen multiple moves through the level, none have stuck, making it the focal point today. We’ve seen the price move back above 66,800 in early Asia, albeit in thin trading with Japanese markets still closed for a prolonged five-day long weekend. As such, while there should be a caveat on the bullish price action, the close today still looms as important.
With RSI (14) trending higher and now back above 50, and MACD having staged a bullish crossover and sitting on the cusp of flipping positive, upside momentum looks to be building, favouring buying dips and breakouts.
If we were to see the current move above 66,800 stick, preferably on a closing basis, longs could be set above the level with a tight stop beneath for protection, initially targeting a test of 69,390, where the index has stalled on four separate occasions earlier this year. 67,366 is a level of note in between, marking the high set on August 27.
A sustained break of 69,390 would have bulls salivating at the prospect of a potential retest of the record highs at 73,520.
If the move above 66,800 fails once again, it would bring the immediate bullish bias into question, opening the door to setups targeting moves in either direction.


The complete CFD trading experience
Award-winning platforms, competitive spreads, low commissions and dedicated support.
We live and breathe the markets and are dedicated to helping traders realise their ambitions as we continue to set the industry bar.
Economic calendar
Web Trader platform
Our sophisticated web-based platform is packed with features.
Related articles
British Pound Technical Outlook: GBP/USD Bulls Fight to Stabilize at Critical Support 10 13 2026
GBP/USD is compressing into a tight near-term range just above key support, with a breakout likely to provide the next directional cue.

EUR/USD forecast: Downside risks persist despite recovery
Amid a lack of any major news, the FX markets have been largely in consolidation mode in the first half of Tuesday’s session. The US dollar eased along with bond yields and oil prices, allowing downbeat currencies like the euro to rebound modestly. With US CPI data due for release on Wednesday, don’t expect much in the way of a sharper decline in USD ahead of it. If anything, we could see the dollar buying resume, especially if crude oil prices catch a bid again amid the ongoing situation.


DAX Recovery Faces Key Test as Bulls Challenge 25,500 Resistance
The DAX continues to recover from last week's sell-off, supported by easing energy concerns and improving short-term momentum. While buyers have regained control of the four-hour trend, the index is now approaching a critical resistance zone between 25,450 and 25,600. A decisive break higher would strengthen the bullish case and open the door toward 25,800, while failure at resistance could quickly revive downside pressure.

StoneX Europe Ltd may make third party material available on this website which may contain information included but not limited to the conditions of financial markets. The material is for information purposes only and does not contain, and should not be construed as containing, investment advice and/or investment recommendation and/or an investment research and/or an offer of or solicitation for any transactions in financial instruments; any decision to enter into a specific transaction shall be made by the client following an assessment by him/her of their situation.
StoneX Europe Ltd makes no representation or warranty and assumes no liability as to the accuracy or completeness of the information provided, nor any loss arising from any investment based on a recommendation, forecast or other information supplied. You should always seek independent advice as to your suitability to speculate in any related markets and your ability to assume the associated risks, if you are at all unsure. We are not under any obligation to update any such material. Any opinion made may be personal to the author and may not reflect the opinion of StoneX Europe Ltd.