



Gold Analysis: XAU/USD falls as bond yields gain strength
The trading week has not been entirely favorable for gold in the short term, as the metal closed the final session of the week with a decline of more than 2.5%. The price is now moving closer to the reference area of $4,500 per ounce, once again highlighting a relevant selling bias in the short term.
Share this:

The trading week has not been entirely favorable for gold in the short term, as the metal closed the final session of the week with a decline of more than 2.5%. The price is now moving closer to the reference area of $4,500 per ounce, once again highlighting a relevant selling bias in the short term.
For now, selling pressure around gold remains mainly driven by expectations of more aggressive central banks, which have made the bond market, a substitute market for gold, increasingly attractive. This has reduced demand appeal for gold in the short term. If this scenario remains in place, weakness in XAU/USD could continue to be relevant over the coming sessions.


Bonds become a threat
One of the events that has most strongly shaped the trading week is that potential inflationary pressures could lead to more aggressive central banks over the coming months. One clear example is the Federal Reserve, where the probability table currently shows that, for the upcoming decisions, there is still a probability above 70% that interest rates will remain unchanged until at least October 2026.
However, from December 2026 onward, a probability above 40% has started to emerge for potential rate hikes toward a new 4.00% reference level. This indicates that expectations around the central bank have shifted from neutral to potentially more restrictive in the coming months, a dynamic that is also being seen in other major central banks around the world.
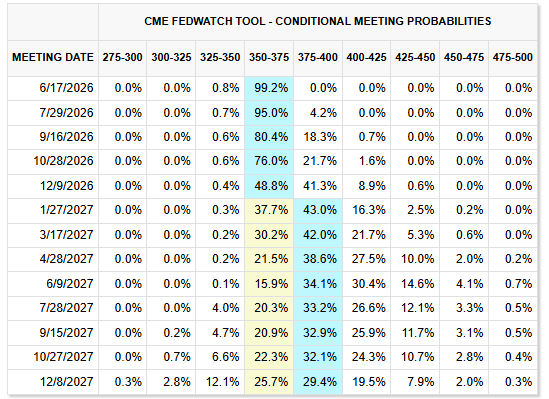
Source: CMEGROUP
This environment of potentially more aggressive central banks, amid rising global inflationary pressures, has also started to change the outlook for the global bond market. In this scenario, US 10-year Treasury bonds stand out, with yields near 4.6%, levels not seen since early 2025.
This dynamic is also present in other markets, such as Canada, where yields remain on an upward slope and are approaching 3.7%, while Japan’s 10-year bond yields have moved above the 2.7% area in the short term. This suggests that the current environment is beginning to reflect a more robust bond market in recent price action.
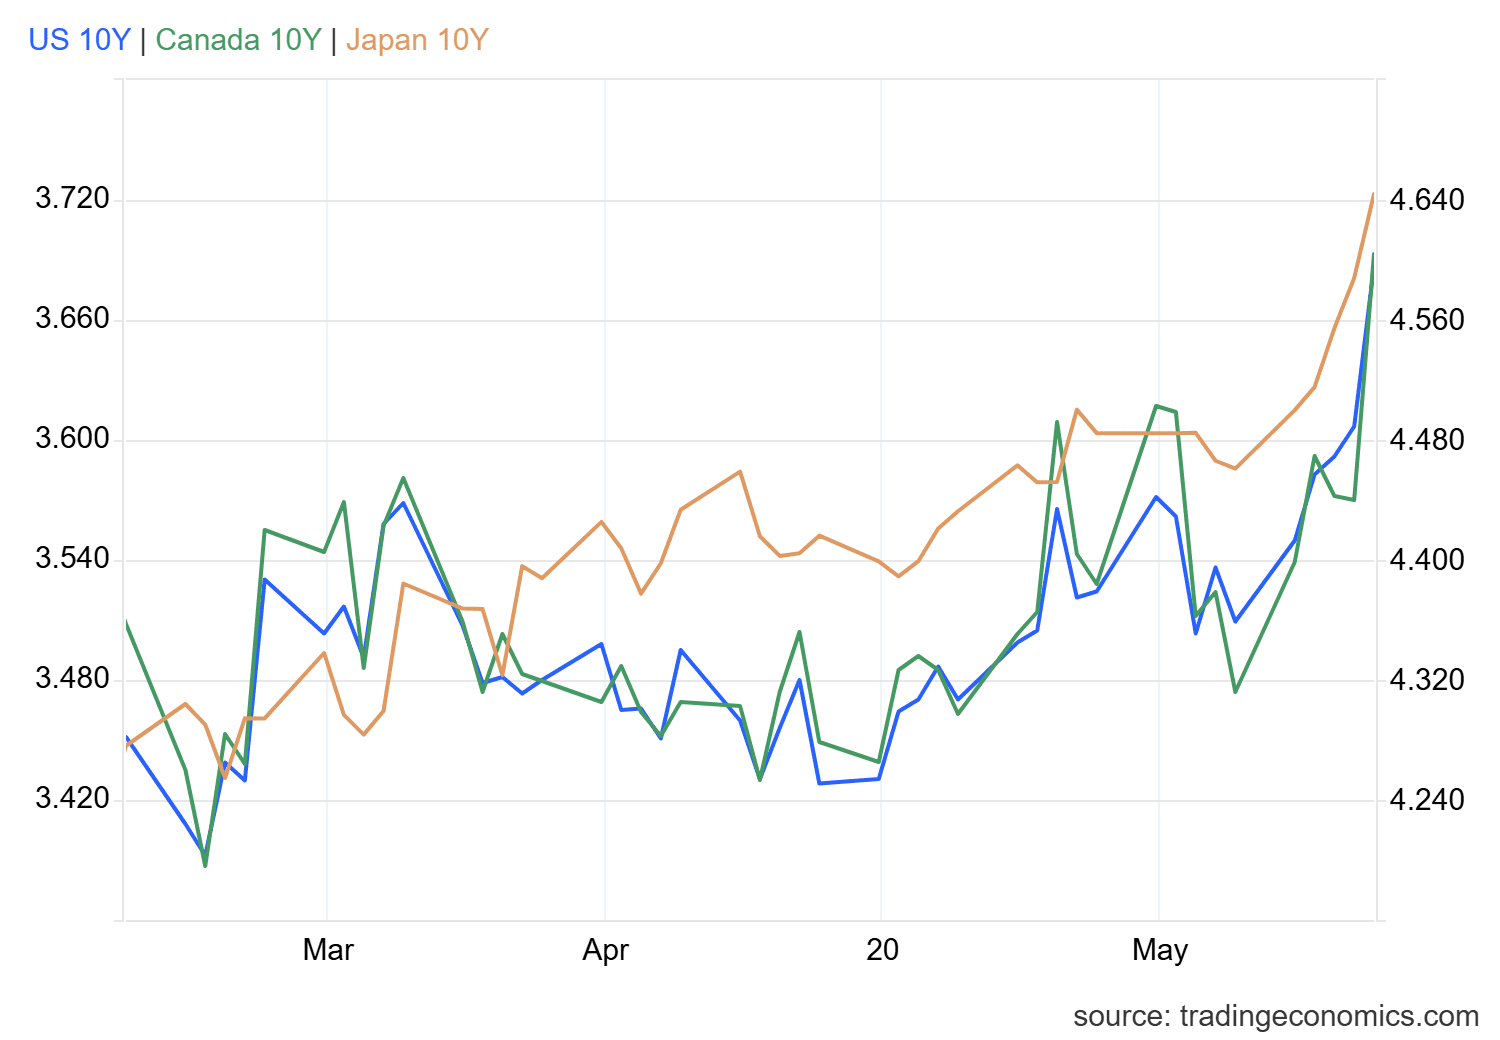
Source: TradingEconomics
This is relevant for gold because the bond market is one of its main substitutes as a safe-haven asset. As interest rates continue to rise, the appeal of the yield offered by these instruments also increases, unlike gold, which does not generate yield. This may be directing capital flows toward bonds rather than the precious metal in the short term, consistently limiting demand for gold.
In fact, when looking at the relationship between rising US 10-year Treasury yields and recent gold price action, it stands out that whenever yields increase consistently, gold tends to show weakness. Over the past 50 sessions, the correlation coefficient shows a negative relationship of -0.76, indicating a relevant inverse relationship between both markets. In other words, when the bond market regains appeal, it tends to weigh on gold to some extent. It is important to remember that correlation coefficients can change over time.

Source: Fuente: StoneX, TVC, Tradingview
Taking all of this into account, if bond markets, especially US Treasury bonds, continue to show a consistent increase in yields, this effect could continue to make it difficult for gold to gain ground in the short term. It could also remain a relevant factor within a scenario of consistent weakness in XAU/USD price action over the coming trading sessions.
Technical outlook for gold

Source: StoneX, Tradingview
- The bearish trendline becomes relevant again: Despite gold’s recovery attempts in previous sessions, the new bearish dynamic continues to reinforce a bearish trendline pattern that has been in place for several months. If price fails to break above this structure, the trendline remains the most relevant technical factor to watch over the coming sessions and could continue to dominate short-term price action.
- TRIX: Now, the TRIX indicator line shows consistent movements below the 0 level, indicating that the selling bias remains present in the average strength of long-term exponential moving averages. This suggests that selling pressure remains relevant within the broader daily chart outlook for gold.
- RSI: The RSI indicator shows a similar dynamic, as the indicator line remains below the neutral 50 level. This suggests that average bearish momentum remains relevant in short-term price action, meaning that, as long as the indicator maintains this behavior, current selling pressure in gold prices could continue to gain importance.
Key levels to watch:
- 4,755 USD – Crucial resistance: A recent high level that coincides with the long-term bearish trendline and the barrier formed by the 50-period simple moving average. Price action that manages to break above this level could put the current bearish trend at risk and give way to a relevant buying bias over the coming weeks.
- 4,600 USD – Near-term barrier: A neutral zone that coincides with the 38.2% Fibonacci retracement of the most relevant move on the chart. This level could act as a tentative barrier in the event of short-term bullish corrections.
- 4,378 USD – Critical support: A recent low level that acts as the main downside barrier. Declines toward this area could reaffirm a dominant selling bias and open the door to an extension of the bearish trendline, which could remain relevant over the coming weeks of trading in gold.
Written by Julian Pineda, CFA, CMT – Market Analyst
Follow him on: @julianpineda25




The complete CFD trading experience
Award-winning platforms, competitive spreads, low commissions and dedicated support.
We live and breathe the markets and are dedicated to helping traders realise their ambitions as we continue to set the industry bar.
Economic calendar
Web Trader platform
Our sophisticated web-based platform is packed with features.
Related articles
Gold forecast: Rising yields become too hot for gold, but the outlook is far from bearish
Gold and silver prices took a plunge today, with the former down 3% and the latter falling some 5% by mid European session, before bouncing off their lows. The losses come after the metals remained largely supported until last week, despite the big dollar rally and surging bond yields as we have seen in recent weeks. But it simply got too much, and the metals succumbed to pressure today.

Gold Dips Below Three-Month Uptrend, Bitcoin Pulls Back from Nine-Month High
Gold has dipped below its three-month uptrend, while Bitcoin has pulled back from a nine-month high as U.S. bond yields test levels last seen in 2004 and 2007. Risks build as Fed rate-hike expectations remain above 70%, while the Dollar Index holds near yearly highs.


Oil, Gold Forecast: Two trades to watch 280926
Oil Rises as U.S.-Iran Peace Hopes Fade. Gold Breaks Down on Hawkish Fed Expectations as Treasury Yields and USD Rise.

StoneX Europe Ltd may make third party material available on this website which may contain information included but not limited to the conditions of financial markets. The material is for information purposes only and does not contain, and should not be construed as containing, investment advice and/or investment recommendation and/or an investment research and/or an offer of or solicitation for any transactions in financial instruments; any decision to enter into a specific transaction shall be made by the client following an assessment by him/her of their situation.
StoneX Europe Ltd makes no representation or warranty and assumes no liability as to the accuracy or completeness of the information provided, nor any loss arising from any investment based on a recommendation, forecast or other information supplied. You should always seek independent advice as to your suitability to speculate in any related markets and your ability to assume the associated risks, if you are at all unsure. We are not under any obligation to update any such material. Any opinion made may be personal to the author and may not reflect the opinion of StoneX Europe Ltd.