




Gold crashes below 1800 What a difference a week makes
One of gold’s biggest tailwinds (unprecedentedly easy monetary policy) may be ending far sooner than many bulls expected.
Share this:

Oh how quickly things can change!
This time last week, gold bulls were riding high, with the yellow metal trading near a 5-month high after a couple-month run outperforming other safe haven and store of value assets…until the script flipped this week.
A hotter-than-expected PPI report on Tuesday, followed up by yesterday’s far more-hawkish-than-expected FOMC meeting, has contributed to a big 100+ point drop in the precious metal so far this week, unwinding nearly six weeks’ worth of gains and leaving gold essentially unchanged over the last year. With inflation on the rise and nearly half (7/17) Fed officials now anticipating at least one rate hike by the end of the next year, the announcement of the central bank’s tapering timeline may be relatively imminent; in other words, one of gold’s biggest tailwinds (unprecedentedly easy monetary policy) may be ending far sooner than many bulls expected.
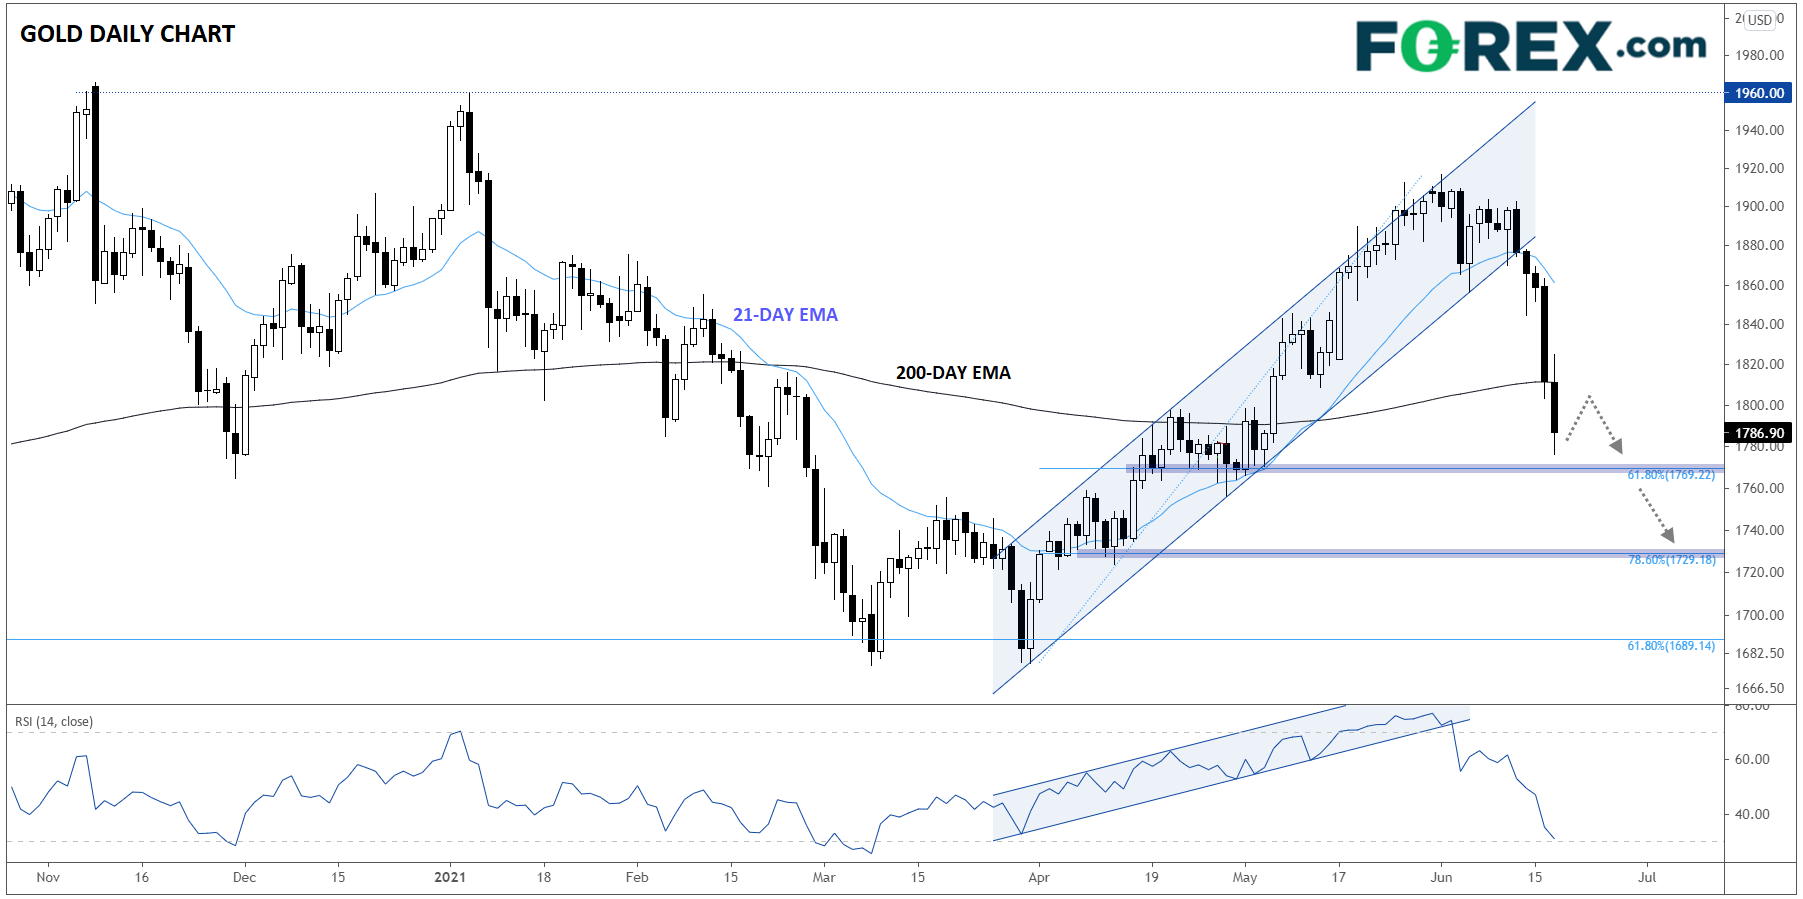
From a technical perspective, gold has crashed through its two-month bullish channel and as of today, is trading back below its 200-day EMA and the $1800 handle. Looking at the 14-day RSI indicator, prices are peeking into oversold territory for the first time since March, so there is some potential for a short-term bounce around $1770 or $1730 (the 61.8% and 78.6% Fibonacci retracements of the April-May rally), but as long as the precious metal remains below the 200-day EMA near $1800, the path of least resistance will remain to the downside:
Source: StoneX, TradingView
Traders are still picking up the pieces from yesterday’s paradigm shift from the Fed, but one thing is clear: it’s a lot less attractive to own gold than it was last week!
How to trade with City Index
Follow these easy steps to start trading with City Index today:
- Open a City Index account, or log-in if you’re already a customer.
- Search for the market you want to trade in our award-winning platform.
- Choose your position and size, and your stop and limit levels.
- Place the trade.
Oh how quickly things can change!
This time last week, gold bulls were riding high, with the yellow metal trading near a 5-month high after a couple-month run outperforming other safe haven and store of value assets…until the script flipped this week.
A hotter-than-expected PPI report on Tuesday, followed up by yesterday’s far more-hawkish-than-expected FOMC meeting, has contributed to a big 100+ point drop in the precious metal so far this week, unwinding nearly six weeks’ worth of gains and leaving gold essentially unchanged over the last year. With inflation on the rise and nearly half (7/17) Fed officials now anticipating at least one rate hike by the end of the next year, the announcement of the central bank’s tapering timeline may be relatively imminent; in other words, one of gold’s biggest tailwinds (unprecedentedly easy monetary policy) may be ending far sooner than many bulls expected.
From a technical perspective, gold has crashed through its two-month bullish channel and as of today, is trading back below its 200-day EMA and the $1800 handle. Looking at the 14-day RSI indicator, prices are peeking into oversold territory for the first time since March, so there is some potential for a short-term bounce around $1770 or $1730 (the 61.8% and 78.6% Fibonacci retracements of the April-May rally), but as long as the precious metal remains below the 200-day EMA near $1800, the path of least resistance will remain to the downside:
Source: StoneX, TradingView
Traders are still picking up the pieces from yesterday’s paradigm shift from the Fed, but one thing is clear: it’s a lot less attractive to own gold than it was last week!
How to trade with FOREX.com
Follow these easy steps to start trading with FOREX.com today:
- Open a Forex.com account, or log-in if you’re already a customer.
- Search for the pair you want to trade in our award-winning platform.
- Choose your position and size, and your stop and limit levels.
- Place the trade.
Related tags:
Latest market news



The complete CFD trading experience
Award-winning platforms, competitive spreads, low commissions and dedicated support.
We live and breathe the markets and are dedicated to helping traders realise their ambitions as we continue to set the industry bar.
Economic calendar
Web Trader platform
Our sophisticated web-based platform is packed with features.
Related articles
S&P 500 forecast: Stocks extend drop as correction risks grow
US and global equity markets have extended Wednesday’s sell-off, with Wall Street opening lower after a weak handover from Asia and Europe. The deterioration in risk appetite has been spreading across global markets. The dollar was firmer, Treasury yields were holding onto yesterday’s gains, while gold, silver and bitcoin were all under pressure alongside equities and major currencies.
Gold forecast: XAU/USD could take a larger dive after the big rise in yields
Gold prices have been falling in the last few days after last week’s post-FOMC pop faded amid rising interest rate expectations, higher oil prices and a strengthening US dollar. As before, I wasn’t convinced gold would thrive in the current macro backdrop.

Gold, silver slammed as hawkish Fed repricing reignites dollar upside
Gold and silver had held up surprisingly well against surging US yields. Wednesday’s DXY breakout may have changed that equation.

StoneX Europe Ltd may make third party material available on this website which may contain information included but not limited to the conditions of financial markets. The material is for information purposes only and does not contain, and should not be construed as containing, investment advice and/or investment recommendation and/or an investment research and/or an offer of or solicitation for any transactions in financial instruments; any decision to enter into a specific transaction shall be made by the client following an assessment by him/her of their situation.
StoneX Europe Ltd makes no representation or warranty and assumes no liability as to the accuracy or completeness of the information provided, nor any loss arising from any investment based on a recommendation, forecast or other information supplied. You should always seek independent advice as to your suitability to speculate in any related markets and your ability to assume the associated risks, if you are at all unsure. We are not under any obligation to update any such material. Any opinion made may be personal to the author and may not reflect the opinion of StoneX Europe Ltd.