




Gold falters around $2,000, although seasonality could be on its side
Gold enjoyed its best month in seven in October, with its 7.3% rise forming a clear bullish engulfing candle and was its third best month of the year. Whether it can extend its rally and make a run for a new record high remains to be seen, but we have seen gold failed around the $2075 highs three times since 2020. What would be so different this time?
Share this:

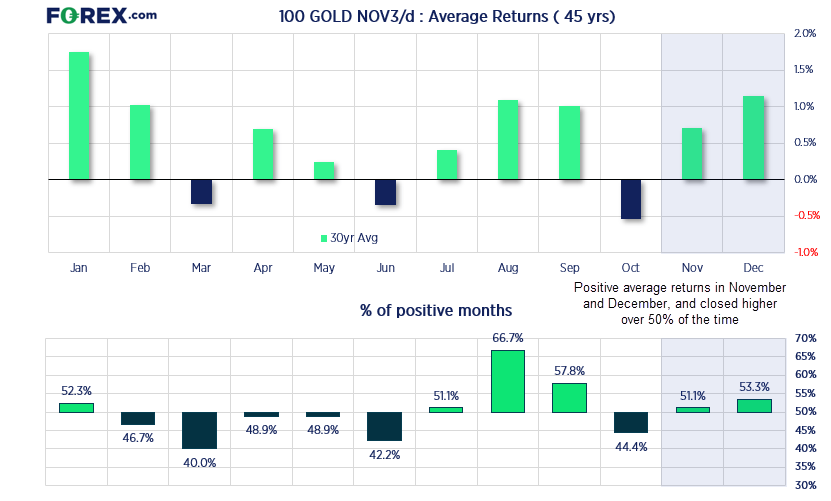
- Gold delivered strong gains in October (its third best month this year)
- Seasonality is on gold’s side for November and December, and is now within striking distance of its record high
- But a record high may not be a slam dunk, given the $2075 area has triggered three multi-month retracements since 2020
- Momentum is turning lower for gold on the daily chart, and shows the potential for a move to at least the $2050 area
Gold enjoyed its best month in seven in October, with its 7.3% rise forming a clear bullish engulfing candle and was its third best month of the year. Whether it can extend its rally and make a run for a new record high remains to be seen, but we have seen gold failed around the $2075 highs three times since 2020. What would be so different this time?
Gold technical analysis (monthly chart):
Well, we could argue that the structure on the monthly chart appears to be more bullish. October’s bullish engulfing low held above the bullish engulfing candle formed in March (a higher low) and momentum is now accelerating into resistance. Seasonality is also on its side, with November and December posting average positive gains over the past 45 years, slightly more than 50% of the time.
Yet the significance of these highs cannot be understated, given each rally to the $2075 area resulted with a multi-month retracement. But for gold to stand any chance of breaking sustainably above the previous high, we’d need to see the US dollar and yields move sharply lower. And that may require a refreshingly dovish Fed to be driven by another round of weaker US employment figures. It certainly is not impossible, but unless US data comes in weaker on aggregate then it seems plausible the Fed may want to push back against dovish market pricing, if inflation remains elevated.

Gold technical analysis (daily chart)
Whilst we wait to see if gold can make a break for a new record high, I suspect gold is due a retracement lower on the daily chart. Gold prices surged nearly 11% over 15 days, and whilst it achieved a daily and weekly close above $2000, prices have since eased and momentum is trying to turn lower. A shooting star candle formed on Friday after failing to hold above $2000, which itself was a lower high and followed by yesterday’s bearish engulfing day.
A move towards the September high / 1950 handle seems plausible from a technical perspective, at which point I’d want to reassess its potential to form a swing low. But even a pullback to $1950 is quite shallow relative to its preceding move, meaning the 50 and 200-day EMAs come into focus (near the 38.2% and 50% retracement levels) should prices break beneath $1950.
-- Written by Matt Simpson
Follow Matt on Twitter @cLeverEdge
How to trade with City Index
You can trade with City Index by following these four easy steps:
- Open an account, or log in if you’re already a customer
• Open an account in the UK
• Open an account in Australia
• Open an account in Singapore
- Search for the market you want to trade in our award-winning platform
- Choose your position and size, and your stop and limit levels
- Place the trade
Related tags:
Latest market news



The complete CFD trading experience
Award-winning platforms, competitive spreads, low commissions and dedicated support.
We live and breathe the markets and are dedicated to helping traders realise their ambitions as we continue to set the industry bar.
Economic calendar
Web Trader platform
Our sophisticated web-based platform is packed with features.
Related articles
Gold Price Forecast: XAU/USD Avoids Breakdown as Yields Surged but Can it Continue?
Surging Treasury yields sent a jolt across markets last week but, so far, gold prices have held above the FOMC low. The big question now is whether that can continue and, if not, will bulls show up at $4100 or $4k like they did in June and July?
Gold Q4 2026 outlook: Resilience in the face of rallying dollar and yields
As we headed towards the latter stages of Q3 and into Q4, the Fed had just hiked rates in a hawkish FOMC meeting, while the likes of the ECB and BoJ had also tightened their respective policies. Oil prices remained elevated amid the prolonged US-Iran conflict. Meanwhile, bond yields were breaking out, and the dollar was higher across the board. Yet, remarkably, gold was still holding in the positive territory for the third quarter, even if it had weakened somewhat in September.


Oil Quietly Hands the Fed a Reason to Stay Hawkish
Oil prices and the U.S. dollar are both on the front foot as elevated energy costs feed Fed warnings that inflation may prove sticky.
StoneX Europe Ltd may make third party material available on this website which may contain information included but not limited to the conditions of financial markets. The material is for information purposes only and does not contain, and should not be construed as containing, investment advice and/or investment recommendation and/or an investment research and/or an offer of or solicitation for any transactions in financial instruments; any decision to enter into a specific transaction shall be made by the client following an assessment by him/her of their situation.
StoneX Europe Ltd makes no representation or warranty and assumes no liability as to the accuracy or completeness of the information provided, nor any loss arising from any investment based on a recommendation, forecast or other information supplied. You should always seek independent advice as to your suitability to speculate in any related markets and your ability to assume the associated risks, if you are at all unsure. We are not under any obligation to update any such material. Any opinion made may be personal to the author and may not reflect the opinion of StoneX Europe Ltd.