






Gold Key US Jobs Data in Focus
Gold has seemingly entered into a consolidation range, as investors await the U.S. ADP private jobs report due tonight (-21 million jobs in April estimated)...
Share this:

Spot gold retreated 0.8% last week, pressured by lockdown lifts and optimism on economic restarts in major countries. However since then, it posted a three-day rebound after reaching a low near $1,671 on May 1, supported by cautions on relaxing coronavirus related restrictions prematurely and expectations that central banks would keep ultra-low interest rates for a certain period of time.
Gold has seemingly entered into a consolidation range, as investors await the U.S. ADP private jobs report due tonight (-21 million jobs in April estimated) and the non-farm payrolls this Friday. It is worth noticing that the market is already anticipating gloomy employment data, where the actual outcome may not take anyone by surprise.
From a technical point of view, spot gold maintains a modestly bullish bias as shown on the 30-minute chart. It is currently trading within a consolidation range, after a technical rebound, where a bullish RSI divergence was spotted. The level at $1,692, which is a recent turning point, may be considered as the nearest intraday support level. A break above the nearest resistance at $1,714 would be needed for gold to gather more upside momentum and open a path to $1,730. In an alternative scenario, losing $1,692 may trigger a pull-back to $1,682 and $1,671 on the downside.
Source: TradingView, Gain Capital
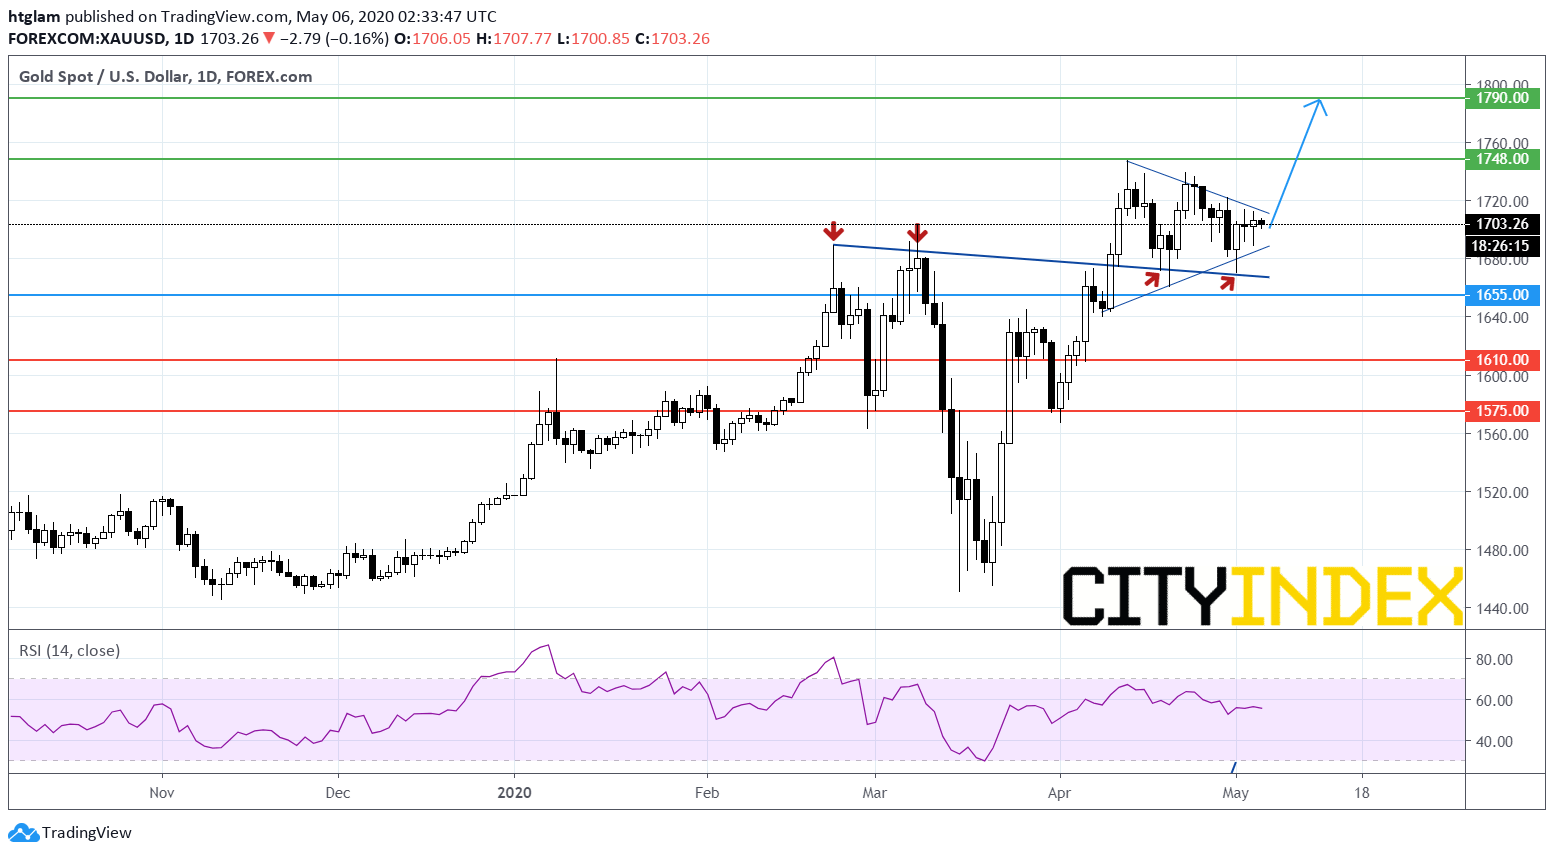
For the longer-term as shown on the daily chart, spot gold is holding up well after surging past its prior high. Despite a modest pull-back, the previous resistance level now acts as a support, which were tested several times. It is now trading within a symmetrical triangle, following a rally previously. Bullish investors might consider $1,655 as the nearest support, with potential upside targets at $1,748 and $1,790. Alternatively, a break below $1,655 may suggest gold is heading back to $1,610 and $1,575.
Source: TradingView, Gain Capital
Spot gold retreated 0.8% last week, pressured by lockdown lifts and optimism on economic restarts in major countries. However since then, it posted a three-day rebound after reaching a low near $1,671 on May 1, supported by cautions on relaxing coronavirus related restrictions prematurely and expectations that central banks would keep ultra-low interest rates for a certain period of time.
Gold has seemingly entered into a consolidation range, as investors await the U.S. ADP private jobs report due tonight (-21 million jobs in April estimated) and the non-farm payrolls this Friday. It is worth noticing that the market is already anticipating gloomy employment data, where the actual outcome may not take anyone by surprise.
From a technical point of view, spot gold maintains a modestly bullish bias as shown on the 30-minute chart. It is currently trading within a consolidation range, after a technical rebound, where a bullish RSI divergence was spotted. The level at $1,692, which is a recent turning point, may be considered as the nearest intraday support level. A break above the nearest resistance at $1,714 would be needed for gold to gather more upside momentum and open a path to $1,730. In an alternative scenario, losing $1,692 may trigger a pull-back to $1,682 and $1,671 on the downside.
Source: TradingView, Gain Capital
For the longer-term as shown on the daily chart, spot gold is holding up well after surging past its prior high. Despite a modest pull-back, the previous resistance level now acts as a support, which were tested several times. It is now trading within a symmetrical triangle, following a rally previously. Bullish investors might consider $1,655 as the nearest support, with potential upside targets at $1,748 and $1,790. Alternatively, a break below $1,655 may suggest gold is heading back to $1,610 and $1,575.
Source: TradingView, Gain Capital
Related tags:
Latest market news



The complete CFD trading experience
Award-winning platforms, competitive spreads, low commissions and dedicated support.
We live and breathe the markets and are dedicated to helping traders realise their ambitions as we continue to set the industry bar.
Economic calendar
Web Trader platform
Our sophisticated web-based platform is packed with features.
Related articles
Gold Price Forecast: XAU/USD Avoids Breakdown as Yields Surged but Can it Continue?
Surging Treasury yields sent a jolt across markets last week but, so far, gold prices have held above the FOMC low. The big question now is whether that can continue and, if not, will bulls show up at $4100 or $4k like they did in June and July?
Gold Q4 2026 outlook: Resilience in the face of rallying dollar and yields
As we headed towards the latter stages of Q3 and into Q4, the Fed had just hiked rates in a hawkish FOMC meeting, while the likes of the ECB and BoJ had also tightened their respective policies. Oil prices remained elevated amid the prolonged US-Iran conflict. Meanwhile, bond yields were breaking out, and the dollar was higher across the board. Yet, remarkably, gold was still holding in the positive territory for the third quarter, even if it had weakened somewhat in September.


Gold forecast: XAU/USD could take a larger dive after the big rise in yields
Gold prices have been falling in the last few days after last week’s post-FOMC pop faded amid rising interest rate expectations, higher oil prices and a strengthening US dollar. As before, I wasn’t convinced gold would thrive in the current macro backdrop.
StoneX Europe Ltd may make third party material available on this website which may contain information included but not limited to the conditions of financial markets. The material is for information purposes only and does not contain, and should not be construed as containing, investment advice and/or investment recommendation and/or an investment research and/or an offer of or solicitation for any transactions in financial instruments; any decision to enter into a specific transaction shall be made by the client following an assessment by him/her of their situation.
StoneX Europe Ltd makes no representation or warranty and assumes no liability as to the accuracy or completeness of the information provided, nor any loss arising from any investment based on a recommendation, forecast or other information supplied. You should always seek independent advice as to your suitability to speculate in any related markets and your ability to assume the associated risks, if you are at all unsure. We are not under any obligation to update any such material. Any opinion made may be personal to the author and may not reflect the opinion of StoneX Europe Ltd.