



S&P 500 technical analysis: Testing broken trend
The S&P 500 futures were edging higher early Thursday, mirroring gains across European markets and extending Wednesday’s late-session rally on Wall Street. The buying in the previous session was led by heavyweight technology stocks, with sentiment buoyed by the perception that the Federal Reserve may be edging closer to a September rate cut.
Share this:

- S&P 500 technical analysis: Bulls holding the line, but price action shows hesitation near resistance
- Macro backdrop: Bond yields retreat as September rate cut bets grow
- Key zones: 6,460/70 is pivotal – breakout could unlock 6,500–6,600 range.
The S&P 500 futures were edging higher early Thursday, mirroring gains across European markets and extending Wednesday’s late-session rally on Wall Street. The buying in the previous session was led by heavyweight technology stocks, with sentiment buoyed by the perception that the Federal Reserve may be edging closer to a September rate cut. The JOLTS job openings data offered further evidence of cooling in the labour market, reinforcing hopes of looser policy. Investors now turn their attention to a busy run of employment data: today’s ADP private payrolls, weekly jobless claims, and ISM Services employment index should help refine expectations for Friday’s non-farm payrolls report – the week’s main event. Ahead of all that, our S&P 500 technical analysis points to caution, especially as September tends to be a not-so-great month for stocks.
Bond market still in the driving seat
The real catalyst for this week’s swings has been the bond market. Tuesday’s sell-off in equities was triggered by a rout in long-dated bonds, which sent yields higher and unnerved risk assets. The turnaround came on Wednesday as bonds staged a recovery, driving the 10-year Treasury yield back down to 4.19% by Thursday morning.
This stabilisation in yields has helped risk appetite return, but it is worth keeping in mind that valuations remain elevated and fiscal concerns continue to linger. If upcoming data hints at stagflationary pressures – weaker growth with sticky inflation – yields could climb again, putting pressure back on equities. Traders would be wise to keep one eye firmly on Treasuries while navigating this week’s macro releases.
S&P 500 technical analysis – Watching broken trend line
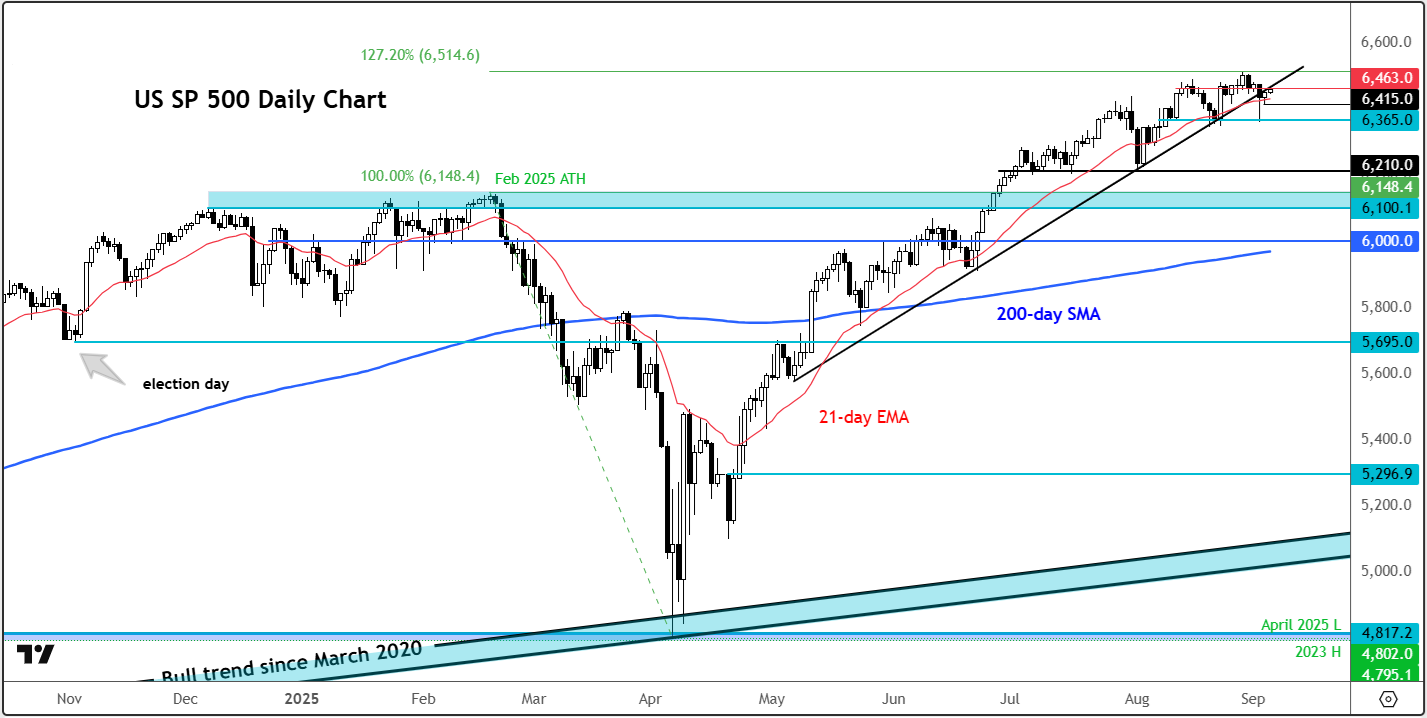
From a technical standpoint, the S&P 500 technical analysis picture remains broadly bullish, but the recent loss of momentum cannot be ignored. Tuesday’s decline saw our US SP 500 index, which is derived from the underlying S&P 500 futures, break its short-term trendline, which led to follow-through selling before dip-buyers stepped in at 6,365ish – a level that has acted as a reliable support zone in recent weeks.
Price action has since rebounded to the 6,460/70 area, which now represents a critical pivot. This area is not just resistance but also marks the underside of the broken trendline. A decisive daily close above here would be technically significant, opening the door for a retest of 6,500 and potentially a new leg higher.
The daily chart also reveals an inside bar pattern, reflecting market indecision after Wednesday’s bounce. Inside bars near resistance often precede sharp moves – either a breakout higher or a reversal lower. Should the index fail to clear 6,460/70 and drop back under Tuesday’s high at 6,453, we could see a quick flush towards 6,415 and potentially a deeper move towards 6,365 to test liquidity below that support.
But should the bulls reclaim 6,460/70 area, the path of least resistance will remain to the upside. Beyond 6,500, there is little overhead supply until the round number of 6,600, with intermediate targets including 6,515 – the 127.2% Fibonacci extension of the February–April downswing.
Short-term risk, long-term structure
While a shakeout cannot be ruled out in the near term, the longer-term structure remains constructive. A measured pullback towards 6,300 or even the 6,100–6,150 zone (the old record high area) would still be considered a healthy retest within a broader uptrend. These levels could attract fresh buyers if the market sees them as value areas.
In short, the bulls remain in control, but they must prove their strength at this key juncture. The next couple of sessions – particularly Friday’s payrolls – could well set the tone for September trading. For now, staying nimble seems the most prudent approach, especially as September is historically one of the worst months for the markets.
-- Written by Fawad Razaqzada, Market Analyst
Follow Fawad on Twitter @Trader_F_R
Related tags:



The complete CFD trading experience
Award-winning platforms, competitive spreads, low commissions and dedicated support.
We live and breathe the markets and are dedicated to helping traders realise their ambitions as we continue to set the industry bar.
Economic calendar
Web Trader platform
Our sophisticated web-based platform is packed with features.
Related articles
Treasury Yields Lose Momentum as Energy ETF Retreats
The 10-year Treasury yield is testing a resistance zone respected since the 1920s, as bearish RSI divergence signals fading upside momentum.

NZD/USD pressure mounts as payrolls looms large
NZD/USD has fallen sharply as Fed rate expectations reset higher, but extreme downside stretch and major support raise the risk of a violent counter-trend rebound.


US Core PCE Preview: Stale or Significant for the Fed
Core PCE inflation takes center stage Wednesday, with traders watching for signs of renewed price pressure and clues on whether the Fed could hike again in October.

StoneX Europe Ltd may make third party material available on this website which may contain information included but not limited to the conditions of financial markets. The material is for information purposes only and does not contain, and should not be construed as containing, investment advice and/or investment recommendation and/or an investment research and/or an offer of or solicitation for any transactions in financial instruments; any decision to enter into a specific transaction shall be made by the client following an assessment by him/her of their situation.
StoneX Europe Ltd makes no representation or warranty and assumes no liability as to the accuracy or completeness of the information provided, nor any loss arising from any investment based on a recommendation, forecast or other information supplied. You should always seek independent advice as to your suitability to speculate in any related markets and your ability to assume the associated risks, if you are at all unsure. We are not under any obligation to update any such material. Any opinion made may be personal to the author and may not reflect the opinion of StoneX Europe Ltd.