



S&P 500 analysis: Stocks fall as growth worries intensify
The short-term S&P 500 analysis appeared bearish but confirmation was needed to tip the balance in the bears’ favour.
Share this:

US markets have remained downbeat a couple of hours into the US session, after futures had tracked Asian and European markets lower. The short-term S&P 500 analysis appeared bearish but confirmation was needed to tip the balance in the bears’ favour.
Why are stocks falling?
While optimism about a debt deal had helped to lift sentiment on Wall Street in recent days, the pressure has been growing from other sources. Chief among them is China where economic activity is faltering. Overnight we had another poor showing from China where the manufacturing sector PMI weakened to 48.8, the lowest since December. From the US we have also had a very poor Chicago PMI, which missed expectations by a mile with a print of 40.4 vs. 47.1 eyed. This puts Thursday’s publication of the ISM manufacturing PMI into focus as concerns about global factory output continue to rise.
With the markets struggling around the world, Wall Street, which has been relatively immune to China’s weakening story so far, is starting to show a few cracks underneath the surface. Friday’s big rally seems like a distant memory already. When China sneezes, Asia tends to catch a cold and we have already seen big falls for antipodean currencies and stocks. On Tuesday, a gauge of Chinese shares traded in Hong Kong fell into a bear market. Overnight, the Hang Seng index also extended its losses to 20% below recent highs, putting it officially in a bear territory. China’s weakness has weighed heavily on European markets because of the fact the nation is a big export destination for European companies, from luxury brands to carmakers.
Until now, A.I. optimism has kept tech stocks supported while other sectors have not done so well, albeit not too poorly either thanks to optimism over a debt deal being achieved soon. However, the increasing probability of another Fed rate hike in June is something that could hold markets back here.
Technical outlook: S&P analysis
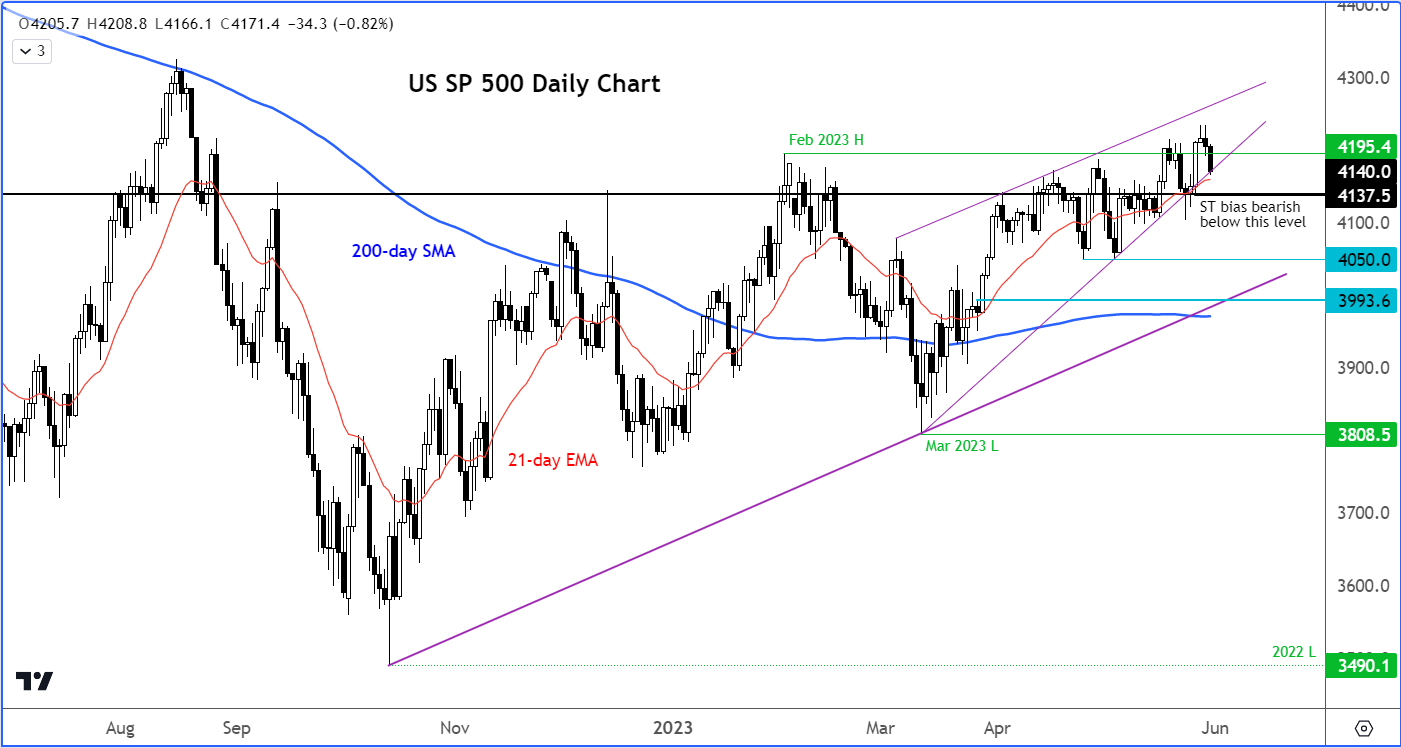
At the time of writing, the S&P 500 was testing a key level of potential support around 4167, resistance from Thursday of last week before it was taken out by a big rally on Friday. If that rally was genuine, then you would expect to see the bulls defend Friday’s gains. A recovery from around this level should not be ruled.
However, if support here breaks down decisively then the odds of the market going on to break Friday’s low would increase. Should we see a move below Friday’s low at 4137 then that would create our first lower low, and thus provide a key bearish reversal signal. For, if the Spoos were to move there, we will also have a breakdown from a wedge pattern to the downside.
Until such a breakdown happens, let’s remain very vigilant, as despite all the odds, the US markets have continually failed the bears this year.
Source: TradingView.com
-- Written by Fawad Razaqzada, Market Analyst
Follow Fawad on Twitter @Trader_F_R
How to trade with City Index
You can trade with City Index by following these four easy steps:
- Open an account, or log in if you’re already a customer
• Open an account in the UK
• Open an account in Australia
• Open an account in Singapore
- Search for the company you want to trade in our award-winning platform
- Choose your position and size, and your stop and limit levels
- Place the trade
Related tags:
Latest market news




The complete CFD trading experience
Award-winning platforms, competitive spreads, low commissions and dedicated support.
We live and breathe the markets and are dedicated to helping traders realise their ambitions as we continue to set the industry bar.
Economic calendar
Web Trader platform
Our sophisticated web-based platform is packed with features.
Related articles
Nasdaq 100 Rebound Puts Bears on Notice
Nasdaq futures are flying despite further negative AI infrastructure headlines. History suggests fading strong Monday opening rallies hasn't always paid off, while the technical picture is starting to turn in favour of bulls.
S&P 500, Nasdaq, Dow and Russell 2000 For the Week Ahead
Stocks started to shake last week and there was even a hint of this in the prior week. The question now is whether we’re at the point where buyers may abandon pullbacks as get closer to mid-term elections.


Gold weekly outlook: XAU/USD remains stuck between a rock and a hard place
Gold remains at risk of staging a deeper correction. Though the dollar has eased back a bit along with yields, both still remain fundamentally supported.
StoneX Europe Ltd may make third party material available on this website which may contain information included but not limited to the conditions of financial markets. The material is for information purposes only and does not contain, and should not be construed as containing, investment advice and/or investment recommendation and/or an investment research and/or an offer of or solicitation for any transactions in financial instruments; any decision to enter into a specific transaction shall be made by the client following an assessment by him/her of their situation.
StoneX Europe Ltd makes no representation or warranty and assumes no liability as to the accuracy or completeness of the information provided, nor any loss arising from any investment based on a recommendation, forecast or other information supplied. You should always seek independent advice as to your suitability to speculate in any related markets and your ability to assume the associated risks, if you are at all unsure. We are not under any obligation to update any such material. Any opinion made may be personal to the author and may not reflect the opinion of StoneX Europe Ltd.