



Target Q1 Preview: Where next for Target stock?
Things are set to become tougher in 2022 as the acceleration in sales unwinds and the company battles against rising costs across the board.
Share this:

When will Target release Q1 2022 earnings?
Target is scheduled to release Q2 earnings before the markets open on Wednesday, May 18th, 2022.
Target Q1 earnings preview
Target’s earnings blew past expectations in the last quarter and capped off another solid year that saw the pandemic continue to boost its sales and earnings. However, things are set to become tougher in 2022 as the acceleration in sales unwinds and the company battles against rising costs across the board.
Wall Street expects Target will see comparable sales rise just 1.2% in the first quarter of 2022, which is markedly slower than the 12.7% average quarterly growth delivered the year before. Overall revenue is forecast to rise 2.2% year-on-year to $24.4 billion.
Adjusted EPS is expected to fall 16.2% from last year to $3.09 as it comes up against tough comparatives from the year before, when earnings rose six-fold.
Still, Target believes it can keep up the momentum this year and has said it is aiming to deliver mid-single digit growth in revenue and high-single digit growth in adjusted EPS in 2022. Wall Street currently believes Target can meet its goals and grow sales by 3.8% and adjusted EPS by 9.1% this year.
That guidance will be closely watched in case Target adjusts its view given the current environment, although Target should prove resilient given its scale and ability to keep prices low for cost-conscious shoppers.’
Where next for Target stock?
Targets stock price has been trading in a wide range over the last year between 184.00 and 268.98. On February 28th, price gapped higher 199.77 to 226.83, and has still yet to fill the gap. TGT reached a near term high on April 21st and has sold off aggressively since then. First support is at the 61.8% Fibonacci retracement level from the lows of February 28th to the highs of April 21st, near 210.90. If price continues to move lower, horizonal support is at 205.22, then the gap fill from February 28th at 199.77. However, if price reverses and moves higher, first horizontal resistance is at 223.20, just ahead of the 50 Day Moving Average at 224.73. If price breaks above there, the next resistance isn’t until the 200 Day Moving Average at 234.04.

Source: Tradingview, Stone X
You can trade Target shares with Forex.com in just four steps:
1. Open a Forex.com account, or log-in if you’re already a customer.
2. Search for ‘Target’ in our award-winning platform
3. Choose your position and size, and your stop and limit levels
4. Place the trade
Or you can try out your trading strategy risk-free by signing up for our Demo Account.
When will Target release Q1 2022 earnings?
Target is scheduled to release Q2 earnings before the markets open on Wednesday, May 18th, 2022.
Target Q1 earnings preview
Target’s earnings blew past expectations in the last quarter and capped off another solid year that saw the pandemic continue to boost its sales and earnings. However, things are set to become tougher in 2022 as the acceleration in sales unwinds and the company battles against rising costs across the board.
Wall Street expects Target will see comparable sales rise just 1.2% in the first quarter of 2022, which is markedly slower than the 12.7% average quarterly growth delivered the year before. Overall revenue is forecast to rise 2.2% year-on-year to $24.4 billion.
Adjusted EPS is expected to fall 16.2% from last year to $3.09 as it comes up against tough comparatives from the year before, when earnings rose six-fold.
Still, Target believes it can keep up the momentum this year and has said it is aiming to deliver mid-single digit growth in revenue and high-single digit growth in adjusted EPS in 2022. Wall Street currently believes Target can meet its goals and grow sales by 3.8% and adjusted EPS by 9.1% this year.
That guidance will be closely watched in case Target adjusts its view given the current environment, although Target should prove resilient given its scale and ability to keep prices low for cost-conscious shoppers.’
Where next for Target stock?
Targets stock price has been trading in a wide range over the last year between 184.00 and 268.98. On February 28th, price gapped higher 199.77 to 226.83, and has still yet to fill the gap. TGT reached a near term high on April 21st and has sold off aggressively since then. First support is at the 61.8% Fibonacci retracement level from the lows of February 28th to the highs of April 21st, near 210.90. If price continues to move lower, horizonal support is at 205.22, then the gap fill from February 28th at 199.77. However, if price reverses and moves higher, first horizontal resistance is at 223.20, just ahead of the 50 Day Moving Average at 224.73. If price breaks above there, the next resistance isn’t until the 200 Day Moving Average at 234.04.
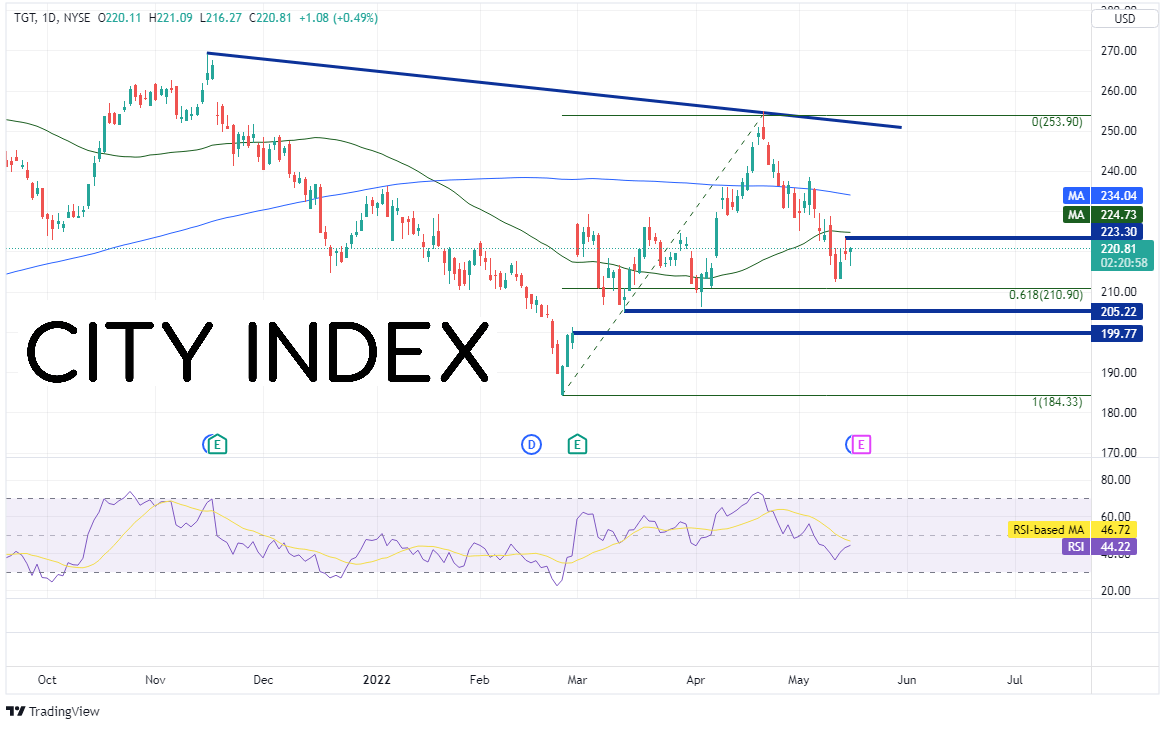
Source: Tradingview, Stone X
You can trade Target shares with City Index in just four easy steps:
1. Open a City Index account, or log-in if you’re already a customer.
2. Search for ‘Target’ in our award-winning platform
3. Choose your position and size, and your stop and limit levels
4. Place the trade
Or you can try out your trading strategy risk-free by signing up for our Demo Trading Account.


The complete CFD trading experience
Award-winning platforms, competitive spreads, low commissions and dedicated support.
We live and breathe the markets and are dedicated to helping traders realise their ambitions as we continue to set the industry bar.
Economic calendar
Web Trader platform
Our sophisticated web-based platform is packed with features.
Related articles
EUR/USD forecast: Eurozone stagflation risks mount as dollar holds firm ahead of data
The dollar was bouncing back at the time of writing, after it had eased overnight on the back of some weaker-than-expected economic data yesterday which had prompted markets to scale back expectations of an October Fed rate hike. However, with more significant US data due today and Friday, and with oil prices continuing to remain elevated, the dollar’s broader direction remains bullish.

Treasury Yields Lose Momentum as Energy ETF Retreats
The 10-year Treasury yield is testing a resistance zone respected since the 1920s, as bearish RSI divergence signals fading upside momentum.


NZD/USD pressure mounts as payrolls looms large
NZD/USD has fallen sharply as Fed rate expectations reset higher, but extreme downside stretch and major support raise the risk of a violent counter-trend rebound.

StoneX Europe Ltd may make third party material available on this website which may contain information included but not limited to the conditions of financial markets. The material is for information purposes only and does not contain, and should not be construed as containing, investment advice and/or investment recommendation and/or an investment research and/or an offer of or solicitation for any transactions in financial instruments; any decision to enter into a specific transaction shall be made by the client following an assessment by him/her of their situation.
StoneX Europe Ltd makes no representation or warranty and assumes no liability as to the accuracy or completeness of the information provided, nor any loss arising from any investment based on a recommendation, forecast or other information supplied. You should always seek independent advice as to your suitability to speculate in any related markets and your ability to assume the associated risks, if you are at all unsure. We are not under any obligation to update any such material. Any opinion made may be personal to the author and may not reflect the opinion of StoneX Europe Ltd.