



US housing data slows, but the Fed is still ready to hike!
Will DXY continue to move up towards the July 14th highs at 106.31? If the Fed insists on continuing to hike rates, it may well be on its way.
Share this:

US housing data released this week for July showed that the housing market is taking a breather as higher interest rates are leading buyers to sit on the sidelines to see if prices will come down. The NAHB Housing Market Index for August was only 49 vs 55 in July. This was the lowest reading since the pandemic lows in May 2020. In addition, Building Permits for July were -1.3% MoM vs +0.1% MoM in June, while Housing starts were -9.6% MoM vs +2.4% MoM in June. Finally, today, Existing Home Sales for July were -5.9% MoM vs -5.5% MoM in June. This was also the lowest level since May 2020. Finally, next week the US will release New Home Sales and Pending Home Sales. Analysts are expecting negative prints for both numbers as well.
Despite the weaker housing data, Fed officials spoke today about the possibility of hiking rates by 75bps at the September meeting. The Fed’s Daly said that she is concerned that core services inflation is still rising and that it was too early to declare victory on inflation, despite inflation at 8.5% YoY. In addition, the Fed’s Bullard said that he is leaning towards a 75bps rate increase in September. He is not ready to say that inflation has peaked and said it is important to get the target rate to 3.75% to 4.00% by the end of the year. The Fed’s George and Kashkari provided similar comments.
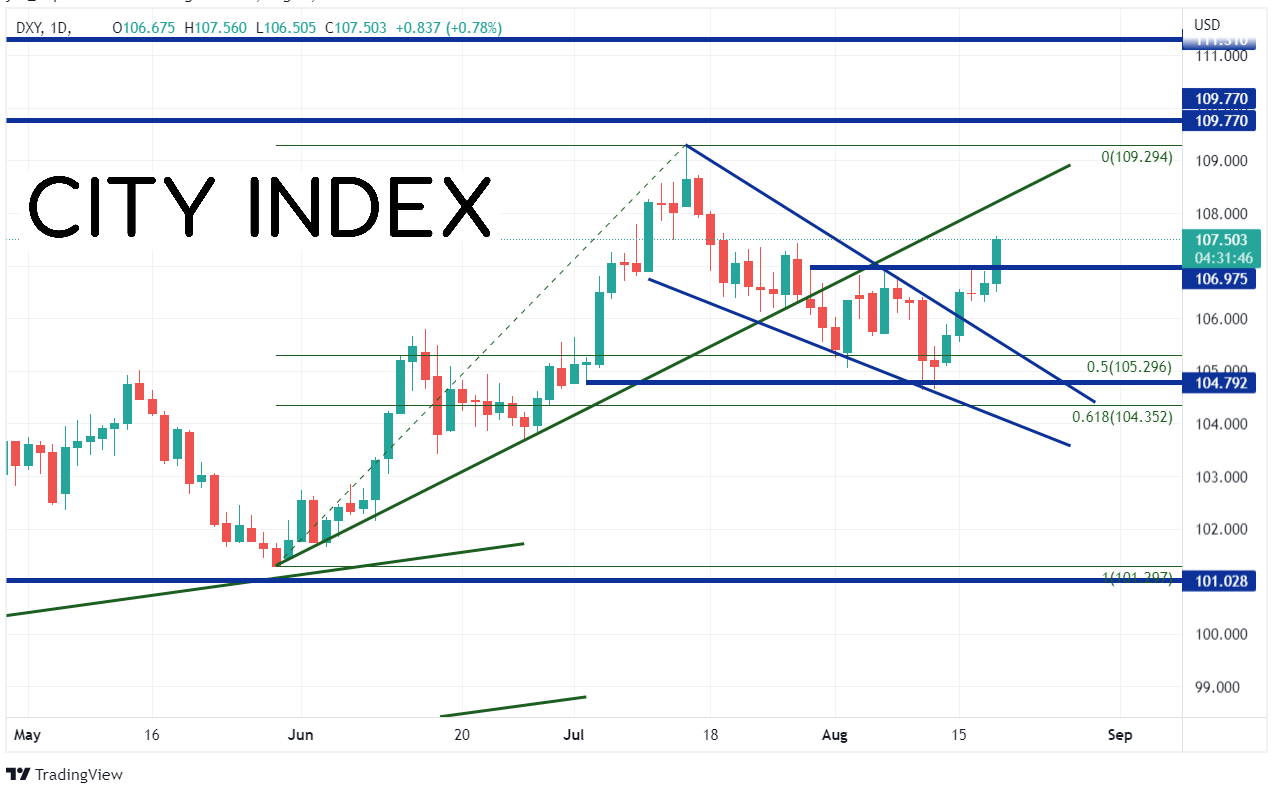
As a result of the hawkish Fed, the US Dollar Index is up nearly 1.00% today. The DXY has been moving aggressively higher since May 31st, when price reached a local low at 101.30. By July 14th, the US dollar reached a 20 year high of 109.24. Since then, the DXY pulled back in a descending wedge formation, breaking an upward sloping trendline dating back to May 31st. Price put in a low at 104.65 on August 11th, just above the 61.8% Fibonacci retracement level from the May 31st low to the July 14th high. Two days later, the DXY broke above the top downward sloping trendline on the descending wedge and ran into resistance at previous highs at 106.98. Today, the DXY broke above the resistance level and traded aggressively higher.

Source: Tradingview, Stone X
On a 240-minute timeframe, DXY is running into resistance at the 61.8% Fibonacci retracement from the highs of July 14th to the lows of August 10th near 107.55. Above there, the next level of resistance is at the green trendline from May 31st near 108.32, then the July 14th high at 109.30. First support below the recent highs is 106.31, which is the lows from August 7th. Below there, price can fall to the top trendline of the descending wedge near 105.50 and then the low from August 10th at 104.64.

Source: Tradingview, Stone X
US Housing data has been poor over the last month. However, the Fed is still of the mind that it needs to continue to hike rates due to high inflation. As a result, the US Dollar Index (DXY) has broken out today above horizontal resistance. Will it continue to move up towards the July 14th highs at 106.31? If the Fed insists on continuing to hike rates, it may be well on its way!
US housing data released this week for July showed that the housing market is taking a breather as higher interest rates are leading buyers to sit on the sidelines to see if prices will come down. The NAHB Housing Market Index for August was only 49 vs 55 in July. This was the lowest reading since the pandemic lows in May 2020. In addition, Building Permits for July were -1.3% MoM vs +0.1% MoM in June, while Housing starts were -9.6% MoM vs +2.4% MoM in June. Finally, today, Existing Home Sales for July were -5.9% MoM vs -5.5% MoM in June. This was also the lowest level since May 2020. Finally, next week the US will release New Home Sales and Pending Home Sales. Analysts are expecting negative prints for both numbers as well.
Despite the weaker housing data, Fed officials spoke today about the possibility of hiking rates by 75bps at the September meeting. The Fed’s Daly said that she is concerned that core services inflation is still rising and that it was too early to declare victory on inflation, despite inflation at 8.5% YoY. In addition, the Fed’s Bullard said that he is leaning towards a 75bps rate increase in September. He is not ready to say that inflation has peaked and said it is important to get the target rate to 3.75% to 4.00% by the end of the year. The Fed’s George and Kashkari provided similar comments.
Everything you need to know about the Federal Reserve
As a result of the hawkish Fed, the US Dollar Index is up nearly 1.00% today. The DXY has been moving aggressively higher since May 31st, when price reached a local low at 101.30. By July 14th, the US dollar reached a 20 year high of 109.24. Since then, the DXY pulled back in a descending wedge formation, breaking an upward sloping trendline dating back to May 31st. Price put in a low at 104.65 on August 11th, just above the 61.8% Fibonacci retracement level from the May 31st low to the July 14th high. Two days later, the DXY broke above the top downward sloping trendline on the descending wedge and ran into resistance at previous highs at 106.98. Today, the DXY broke above the resistance level and traded aggressively higher.
Source: Tradingview, Stone X
Trade USD/JPY now: Login or Open a new account!
• Open an account in the UK
• Open an account in Australia
• Open an account in Singapore
On a 240-minute timeframe, DXY is running into resistance at the 61.8% Fibonacci retracement from the highs of July 14th to the lows of August 10th near 107.55. Above there, the next level of resistance is at the green trendline from May 31st near 108.32, then the July 14th high at 109.30. First support below the recent highs is 106.31, which is the lows from August 7th. Below there, price can fall to the top trendline of the descending wedge near 105.50 and then the low from August 10th at 104.64.

Source: Tradingview, Stone X
US Housing data has been poor over the last month. However, the Fed is still of the mind that it needs to continue to hike rates due to high inflation. As a result, the US Dollar Index (DXY) has broken out today above horizontal resistance. Will it continue to move up towards the July 14th highs at 106.31? If the Fed insists on continuing to hike rates, it may be well on its way!
Related tags:


The complete CFD trading experience
Award-winning platforms, competitive spreads, low commissions and dedicated support.
We live and breathe the markets and are dedicated to helping traders realise their ambitions as we continue to set the industry bar.
Economic calendar
Web Trader platform
Our sophisticated web-based platform is packed with features.
Related articles

NZD/USD pressure mounts as payrolls looms large
NZD/USD has fallen sharply as Fed rate expectations reset higher, but extreme downside stretch and major support raise the risk of a violent counter-trend rebound.


US Core PCE Preview: Stale or Significant for the Fed
Core PCE inflation takes center stage Wednesday, with traders watching for signs of renewed price pressure and clues on whether the Fed could hike again in October.


Australian Dollar Forecast: AUD/USD Four-Week Slide Nears Critical Uptrend Support 9 29 2026
Aussie momentum has deteriorated sharply into quarter-end, with inflation, Core PCE and NFP on tap as AUD/USD closes in on a pivotal technical threshold.

StoneX Europe Ltd may make third party material available on this website which may contain information included but not limited to the conditions of financial markets. The material is for information purposes only and does not contain, and should not be construed as containing, investment advice and/or investment recommendation and/or an investment research and/or an offer of or solicitation for any transactions in financial instruments; any decision to enter into a specific transaction shall be made by the client following an assessment by him/her of their situation.
StoneX Europe Ltd makes no representation or warranty and assumes no liability as to the accuracy or completeness of the information provided, nor any loss arising from any investment based on a recommendation, forecast or other information supplied. You should always seek independent advice as to your suitability to speculate in any related markets and your ability to assume the associated risks, if you are at all unsure. We are not under any obligation to update any such material. Any opinion made may be personal to the author and may not reflect the opinion of StoneX Europe Ltd.