



USDJPY, Nasdaq Outlook: DXY Resistance, Earnings, and Tariffs
The DXY is facing resistance near the 100 level, USDJPY is testing the 153.40 barrier, and the Nasdaq has rebounded from the 24,000 support, now facing resistance around 24,800. How will tariff developments and key earnings reports shape market trends this week?
Share this:

Key Events
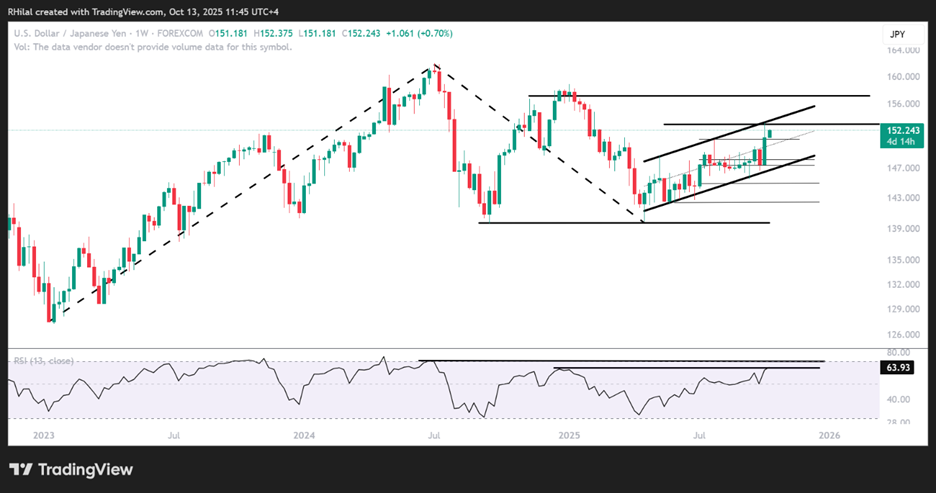
- USDJPY is facing a six-month resistance at 153.40, with weekly overbought levels last seen in December 2024.
- Nasdaq is in recovery mode following U.S.–China tariff volatility, testing the 24,800-mark ahead of U.S. bank earnings on Tuesday and Wednesday, and Taiwan Semiconductor earnings on Thursday.
- U.S. economic reports, notably the CPI, remain tentative due to the ongoing government shutdown.
Market volatility remains anchored between multiple layers of uncertainty — the U.S. government shutdown, U.S.–China tariff tensions, unreleased economic data, rate-cut expectations, and anticipation ahead of corporate earnings.
Headlines are expected to fluctuate as markets digest short-term distress while looking toward future resolutions. This backdrop keeps havens near record highs, the dollar firm yet facing resistance below the 100.20 mark, and U.S. indices in a fragile recovery mode after Friday’s sell-off from overheated levels.
Will we see another tariff sell-off, tariff delay, and bull-run scenario play out on the charts again?
Technical Analysis: Quantifying Uncertainties
USDJPY Outlook: Weekly Time Frame – Log Scale
Source: Tradingview
USDJPY’s positive rebound from the April 2025 lows (139.88) has respected the bounds of a 6-month parallel channel, reaching the 0.382 Fibonacci resistance of the trend extending between the January 2023 low (127.22), July 2024 high (161.95), and April 2025 low (139.88) at 153.40.
A clean hold above 153.40 is expected to drive the trend toward the next Fibonacci level at the 0.5 extension, aligning with the 2025 highs near 157.
On the downside, with weekly overbought conditions aligning with highs last seen in Dec 2024, a drop back below 150.90 could trigger a revisit to the channel’s lower boundary near 148 and 147.40.
Nasdaq Outlook: Daily Time Frame – Log Scale
Source: Tradingview
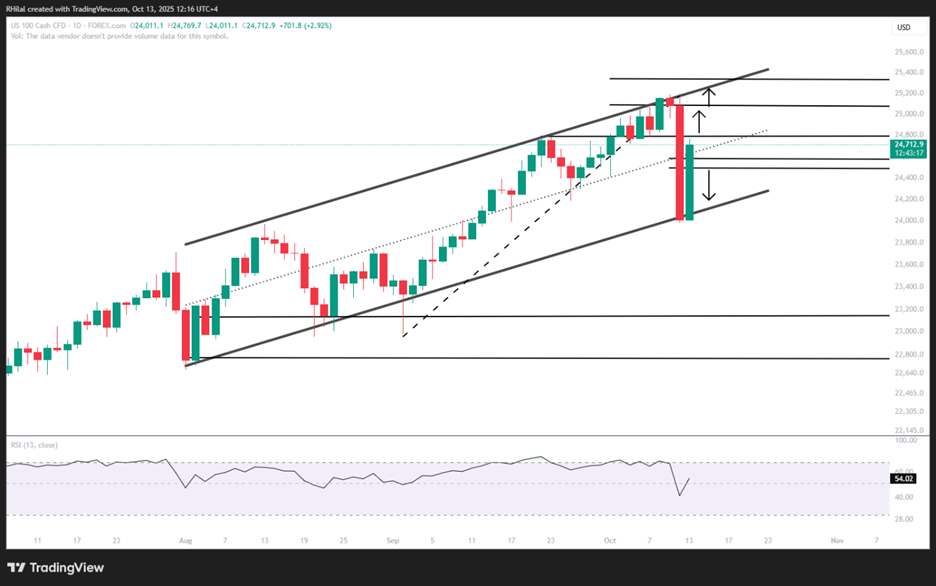
The recent tariff hit on the Nasdaq aligned with the 25,000 zone and the August–October resistance line, connecting the upper bound of a parallel channel that the Nasdaq continues to respect. After rebounding cleanly from the 24,000 support, price action is now trading near the midpoint of the channel as tariff headlines evolve and ahead of major bank and semiconductor earnings this week.
Currently, price is testing the 24,800-resistance. A clean break above could extend gains toward 25,000 and a new high near 25,300, realigning with the upper boundary before confirming another bullish breakout toward 26,000.
On the downside, if tariff concerns resurface — similar to the early 2025 sell-off following the reciprocal tariff announcement — a clean break below 23,900 could trigger another 1,000-point drop toward 23,100 and 22,700, potentially setting up another long-term bullish opportunity.
Written by Razan Hilal, CMT
Follow on X: @Rh_waves
Related tags:


The complete CFD trading experience
Award-winning platforms, competitive spreads, low commissions and dedicated support.
We live and breathe the markets and are dedicated to helping traders realise their ambitions as we continue to set the industry bar.
Economic calendar
Web Trader platform
Our sophisticated web-based platform is packed with features.
Related articles
NZD/USD pressure mounts as payrolls looms large
NZD/USD has fallen sharply as Fed rate expectations reset higher, but extreme downside stretch and major support raise the risk of a violent counter-trend rebound.

US Core PCE Preview: Stale or Significant for the Fed
Core PCE inflation takes center stage Wednesday, with traders watching for signs of renewed price pressure and clues on whether the Fed could hike again in October.


Japanese Yen Technical Analysis: USD/JPY Support Test into Core PCE
USD/JPY has been a battlefield for the past two months as the force of intervention and the threat of more have given sellers an advantage, even as buyers have continued to bid support on pullbacks. This sets the stage for a massive finish to the week with Core PCE and Non-farm Payrolls.

StoneX Europe Ltd may make third party material available on this website which may contain information included but not limited to the conditions of financial markets. The material is for information purposes only and does not contain, and should not be construed as containing, investment advice and/or investment recommendation and/or an investment research and/or an offer of or solicitation for any transactions in financial instruments; any decision to enter into a specific transaction shall be made by the client following an assessment by him/her of their situation.
StoneX Europe Ltd makes no representation or warranty and assumes no liability as to the accuracy or completeness of the information provided, nor any loss arising from any investment based on a recommendation, forecast or other information supplied. You should always seek independent advice as to your suitability to speculate in any related markets and your ability to assume the associated risks, if you are at all unsure. We are not under any obligation to update any such material. Any opinion made may be personal to the author and may not reflect the opinion of StoneX Europe Ltd.