








Weekly and Monthly Bearish Engulfing Candles Appear On DXY But Just How Grizzly Are They
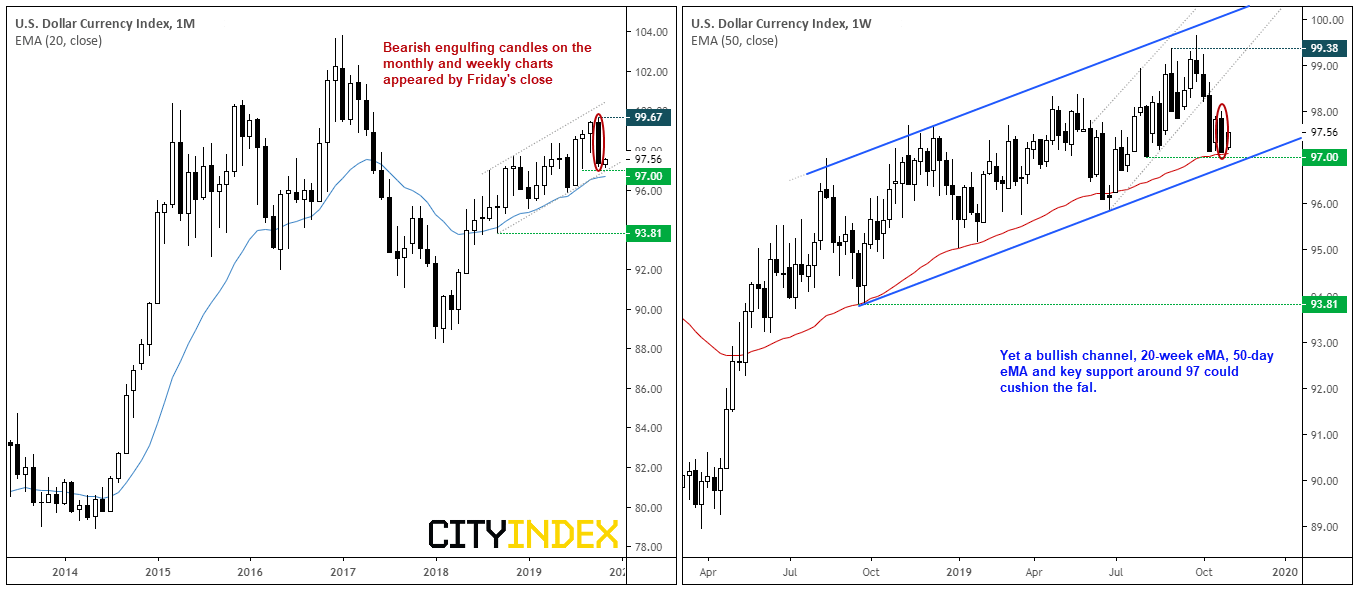
The USD index (DXY) presented traders with a bearish engulfing candle on both the weekly and monthly chart by Friday’s close. So, will this bearish pattern live up to its grizzly name in the weeks ahead?
Share this:

The USD index (DXY) presented traders with a bearish engulfing candle on both the weekly and monthly chart by Friday’s close. So, will this bearish pattern live up to its grizzly name in the weeks ahead?
As of Friday, it was DXY’s most bearish close since January 2018. Yet key support around 97 previously highlighted has continued to hold and bulls managed a minor rally from this level yesterday. We doubt it will be easy for bears to break 97 easily and, even if they do, there’s also the 20-week eMA and lower trendline to content with. But, for today we’ll see just how bearish a bearish engulfing candle is. Using Reuters data from 1986, here’s how bearish engulfing candles have played out in the following months and weeks.
- The first thing to note here is the small sample size; being below 30, it’s not considered to be large enough to be statistically significant (so we can be less confidence in the results).
- Still, it’s interesting to note that the month following an engulfing candle has been bearish over 50% of the time, with T+5 months being the most bearish. If this were to be repeated, then March could be a bear-fest for USD. And worth noting that over the past 15 years, DXY has produced negative returns on average.
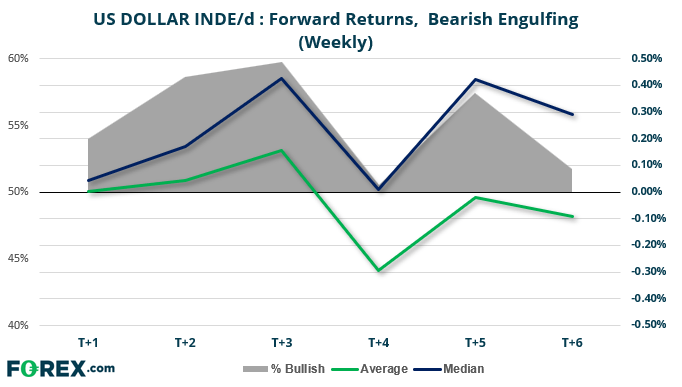
- Beyond these points, it’s hard to build a compelling bearish case from this chart as median and average returns diverge and T+2, T+3 and T+6 produced bullish candles over 50% of the time.
- Sample size: 87
- Well, that doesn’t look particularly bearish to me. In fact, the only negative return is T+4 average, whereas T+4 median is ‘typically’ flat
- Average and median returns become increasingly bullish between T+1 to T+3, and all produce bullish candles over 50% of the time.
- T+3 produces bullish candles nearly 60% of the time
- Average returns are negative between T+4 and T+6, whilst median (typically) returns are positive over T+1 to T+6
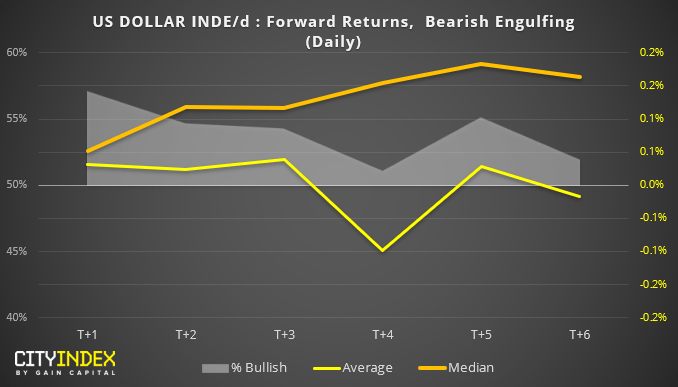
Whilst we’re here, we may as well include the results for the daily chart too. Yet the results appear similar to the weekly data; bearish engulfing candles on the daily are typically bullish over 50% of the time between T+1 to T+6.
From the data above, it doesn’t appear that bearish engulfing candles on DXY have been favourable to bears on the weekly and daily charts. Given the key level of support nearby and the fact that most of my Twitter feed is now bearish on the USD, the contrarian within me wonders if there may be further upside on the dollar over the coming week/s.
The USD index (DXY) presented traders with a bearish engulfing candle on both the weekly and monthly chart by Friday’s close. So, will this bearish pattern live up to its grizzly name in the weeks ahead?
As of Friday, it was DXY’s most bearish close since January 2018. Yet key support around 97 previously highlighted has continued to hold and bulls managed a minor rally from this level yesterday. We doubt it will be easy for bears to break 97 easily and, even if they do, there’s also the 20-week eMA and lower trendline to content with. But, for today we’ll see just how bearish a bearish engulfing candle is. Using Reuters data from 1986, here’s how bearish engulfing candles have played out in the following months and weeks.
- The first thing to note here is the small sample size; being below 30, it’s not considered to be large enough to be statistically significant (so we can be less confidence in the results).
- Still, it’s interesting to note that the month following an engulfing candle has been bearish over 50% of the time, with T+5 months being the most bearish. If this were to be repeated, then March could be a bear-fest for USD. And worth noting that over the past 15 years, DXY has produced negative returns on average.
- Beyond these points, it’s hard to build a compelling bearish case from this chart as median and average returns diverge and T+2, T+3 and T+6 produced bullish candles over 50% of the time.
- Sample size: 87
- Well, that doesn’t look particularly bearish to me. In fact, the only negative return is T+4 average, whereas T+4 median is ‘typically’ flat
- Average and median returns become increasingly bullish between T+1 to T+3, and all produce bullish candles over 50% of the time.
- T+3 produces bullish candles nearly 60% of the time
- Average returns are negative between T+4 and T+6, whilst median (typically) returns are positive over T+1 to T+6
Whilst we’re here, we may as well include the results for the daily chart too. Yet the results appear similar to the weekly data; bearish engulfing candles on the daily are typically bullish over 50% of the time between T+1 to T+6.
From the data above, it doesn’t appear that bearish engulfing candles on DXY have been favourable to bears on the weekly and daily charts. Given the key level of support nearby and the fact that most of my Twitter feed is now bearish on the USD, the contrarian within me wonders if there may be further upside on the dollar over the coming week/s.
Related tags:




The complete CFD trading experience
Award-winning platforms, competitive spreads, low commissions and dedicated support.
We live and breathe the markets and are dedicated to helping traders realise their ambitions as we continue to set the industry bar.
Economic calendar
Web Trader platform
Our sophisticated web-based platform is packed with features.
Related articles
StoneX Europe Ltd may make third party material available on this website which may contain information included but not limited to the conditions of financial markets. The material is for information purposes only and does not contain, and should not be construed as containing, investment advice and/or investment recommendation and/or an investment research and/or an offer of or solicitation for any transactions in financial instruments; any decision to enter into a specific transaction shall be made by the client following an assessment by him/her of their situation.
StoneX Europe Ltd makes no representation or warranty and assumes no liability as to the accuracy or completeness of the information provided, nor any loss arising from any investment based on a recommendation, forecast or other information supplied. You should always seek independent advice as to your suitability to speculate in any related markets and your ability to assume the associated risks, if you are at all unsure. We are not under any obligation to update any such material. Any opinion made may be personal to the author and may not reflect the opinion of StoneX Europe Ltd.