






Weekly COT Report Dollar Bulls Retreat
A summary of the weekly Commitment of Traders Report (COT) from CFTC to show market positioning among large speculators.
Share this:

Read our guide on how to interpret the weekly COT report
As of Tuesday 17th December:
- Large speculators were net-long USD by $14.5 billion, down by $3.6 billion the prior week
- Bullish exposure fell to DXY its lowest level in 18-months
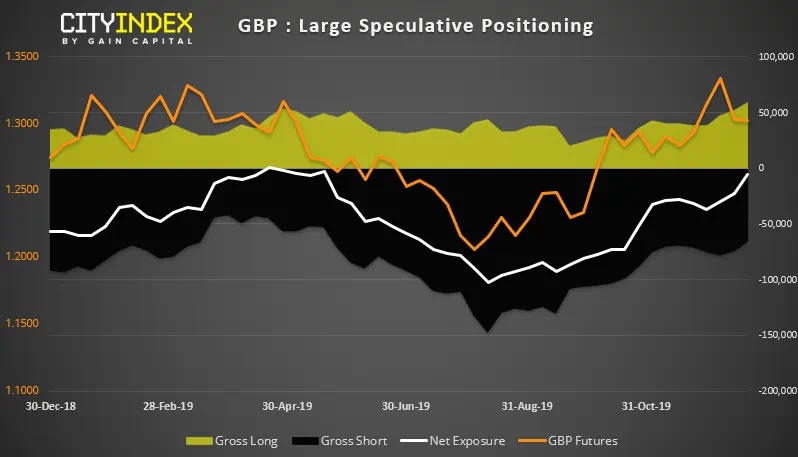
- GBP traders were on the verge of flipping to net-long exposure, at just -5.8k contracts net-short
- Traders were their least bearish on NZD in 8-months
DXY: Bullish exposure fell to its lowest level in 18-months. Falling by -10.6k contracts, it was its largest weekly fall in 2.5 years. Gross longs are their lowest level since April 2018 and gross shorts have risen to a 3-month high. However, whilst this leaves room for further downside as we head into the new year, the monthly chart is on track for a bullish hammer which would be confirmed with a break above 98.38.
GBP: We were half expecting to see GBP traders flip to net-long exposure after Johnsons election victory. Yet with doubts still lingering over Brexit, it was not to be. And given GBP has retraced all of its election gains, its likely to remain net-short until we see a major breakthrough and confirmation that a hard Brexit will be avoided. For now, 1.30 appears to be a sticky level heading into 2020.
NZD: Bears have continued to capitulate, yet bulls remain cautiously on the side. We expect this to change as we head into 2020 as economic data overwhelmingly points towards a hold, and traders still don’t appear to be positioned for this outcome.
As of Tuesday 17th December:
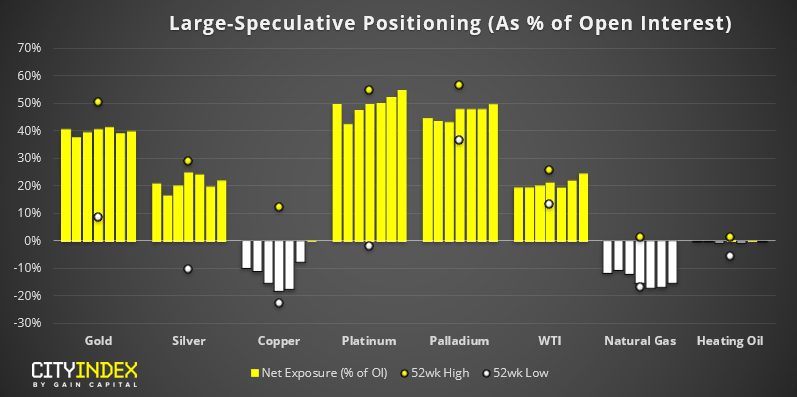
- Traders were their most bullish on WTI in 8 months
- Large speculators flipped to net-long on copper
- Net-long exposure on platinum was at its highest level since August 2016
- Net-long exposure to gold remains defiantly long at +286.8k contracts, yet largely unchanged over the past few weeks
WTI: Oil is back above $60 and net-long exposure is at its highest level since April. Technically it remains within a bullish channel, although a two-bar reversal on Friday warns of a retracement from the highs. As we head into the new year, we remain bullish above 58.70 – 59.00.
Read our guide on how to interpret the weekly COT report
As of Tuesday 17th December:
- Large speculators were net-long USD by $14.5 billion, down by $3.6 billion the prior week
- Bullish exposure fell to DXY its lowest level in 18-months
- GBP traders were on the verge of flipping to net-long exposure, at just -5.8k contracts net-short
- Traders were their least bearish on NZD in 8-months
DXY: Bullish exposure fell to its lowest level in 18-months. Falling by -10.6k contracts, it was its largest weekly fall in 2.5 years. Gross longs are their lowest level since April 2018 and gross shorts have risen to a 3-month high. However, whilst this leaves room for further downside as we head into the new year, the monthly chart is on track for a bullish hammer which would be confirmed with a break above 98.38.
GBP: We were half expecting to see GBP traders flip to net-long exposure after Johnsons election victory. Yet with doubts still lingering over Brexit, it was not to be. And given GBP has retraced all of its election gains, its likely to remain net-short until we see a major breakthrough and confirmation that a hard Brexit will be avoided. For now, 1.30 appears to be a sticky level heading into 2020.
NZD: Bears have continued to capitulate, yet bulls remain cautiously on the side. We expect this to change as we head into 2020 as economic data overwhelmingly points towards a hold, and traders still don’t appear to be positioned for this outcome.
As of Tuesday 17th December:
- Traders were their most bullish on WTI in 8 months
- Large speculators flipped to net-long on copper
- Net-long exposure on platinum was at its highest level since August 2016
- Net-long exposure to gold remains defiantly long at +286.8k contracts, yet largely unchanged over the past few weeks
WTI: Oil is back above $60 and net-long exposure is at its highest level since April. Technically it remains within a bullish channel, although a two-bar reversal on Friday warns of a retracement from the highs. As we head into the new year, we remain bullish above 58.70 – 59.00.


The complete CFD trading experience
Award-winning platforms, competitive spreads, low commissions and dedicated support.
We live and breathe the markets and are dedicated to helping traders realise their ambitions as we continue to set the industry bar.
Economic calendar
Web Trader platform
Our sophisticated web-based platform is packed with features.
Related articles
Nasdaq 100 Forecast: NDX falls as oil jumps and Treasury yields rise
U.S. stocks are pointing to a weaker open on Monday after President Trump rejected an Iranian ceasefire, sending oil prices higher and fuelling inflationary concerns and pushing Treasury yields higher.

AUD/USD forecast: Currency Pair of the Week | September 28, 2026
The week has started with stocks, gold, silver and bitcoin all falling, as crude oil rebounded and bond yields pushed further higher. Trump refusing to agree to Tehran’s proposal to re-open the Strait of Hormuz has left the markets disappointed. Still, reports that mediators are expected to hold talks with the two sides on an amended version of the 7-day proposal that Iran presented, keeps hopes alive that we may see some progress.


Gold Dips Below Three-Month Uptrend, Bitcoin Pulls Back from Nine-Month High
Gold has dipped below its three-month uptrend, while Bitcoin has pulled back from a nine-month high as U.S. bond yields test levels last seen in 2004 and 2007. Risks build as Fed rate-hike expectations remain above 70%, while the Dollar Index holds near yearly highs.

StoneX Europe Ltd may make third party material available on this website which may contain information included but not limited to the conditions of financial markets. The material is for information purposes only and does not contain, and should not be construed as containing, investment advice and/or investment recommendation and/or an investment research and/or an offer of or solicitation for any transactions in financial instruments; any decision to enter into a specific transaction shall be made by the client following an assessment by him/her of their situation.
StoneX Europe Ltd makes no representation or warranty and assumes no liability as to the accuracy or completeness of the information provided, nor any loss arising from any investment based on a recommendation, forecast or other information supplied. You should always seek independent advice as to your suitability to speculate in any related markets and your ability to assume the associated risks, if you are at all unsure. We are not under any obligation to update any such material. Any opinion made may be personal to the author and may not reflect the opinion of StoneX Europe Ltd.