



What does the US dollar have to say about gold ?
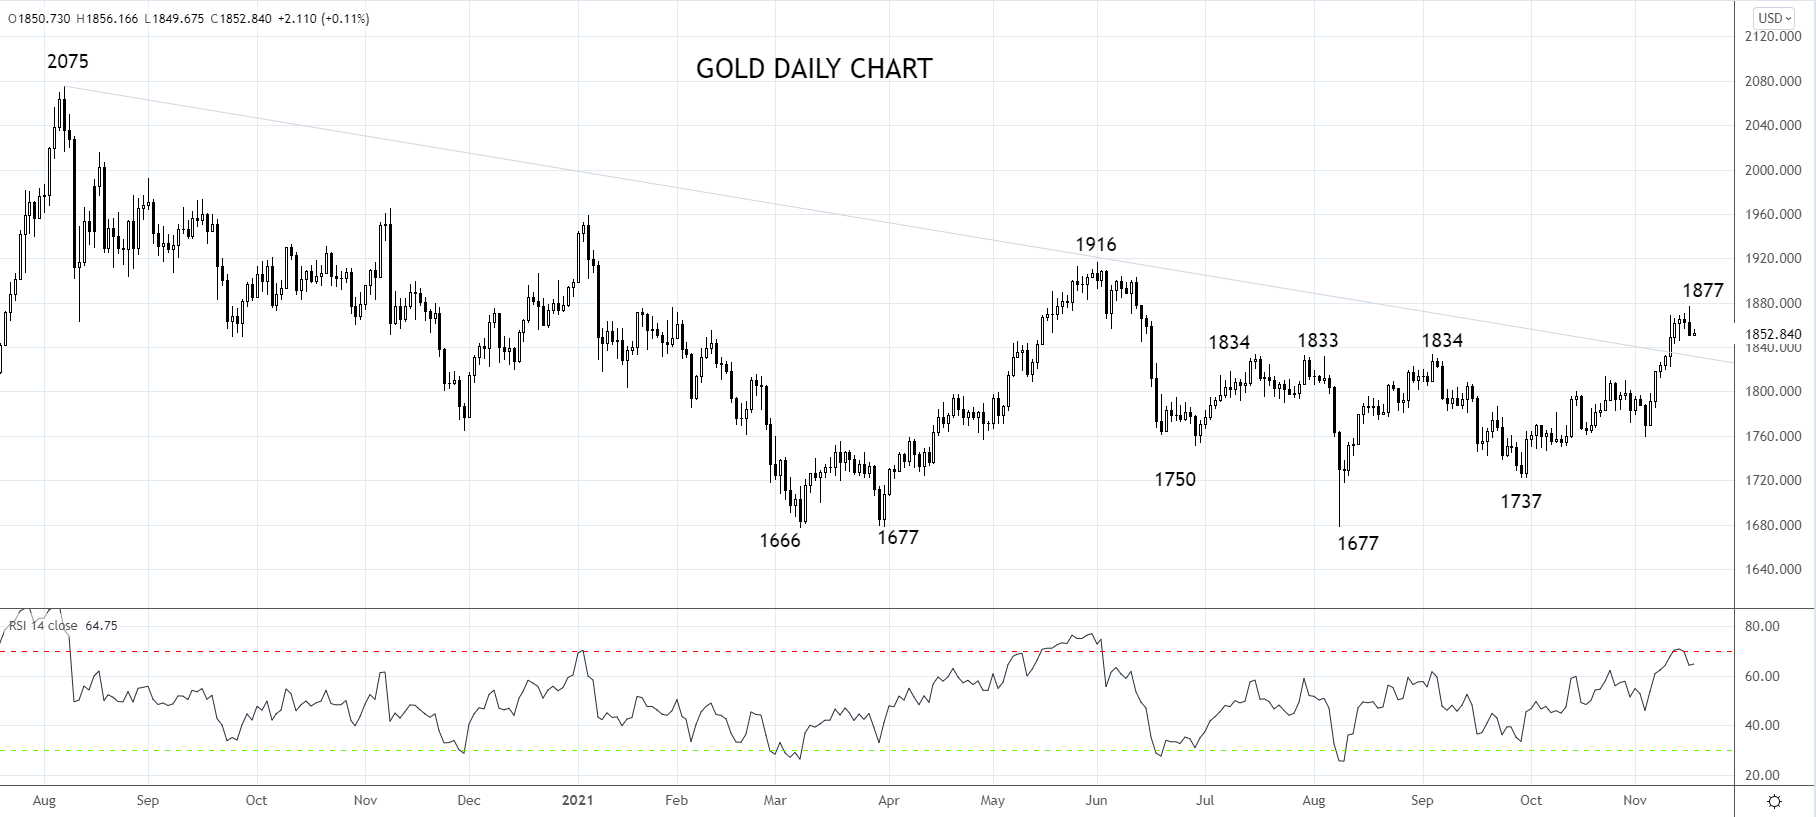
After making fresh cycle highs overnight at $1877, gold slumped to close near $1850 after robust U.S. economic data sent the U.S. dollar, real yields, and nominal U.S. yields higher.
Share this:

Generally speaking, a lower U.S. dollar and lower yields are supportive of a higher gold price. Last week the breakdown in real yields was a key factor behind our long gold trade suggestion in this article here (long gold at an average of $1845).
Although 10 year real yields have bounced from -117bp to -110bp in recent sessions, resistance is viewed at -100bp, where they broke down from in early November. As such negative real yields are likely to remain supportive of gold in the medium term.
However, should the U.S. dollar continue to power higher, it would be a significant setback to last week's break higher in gold.
Using the U.S dollar index, the DXY, as our barometer for U.S. dollar directionality, after an impressive rally over the past week, the DXY index is currently testing the resistance coming from the top of the upward sloping trend channel near 96.00.
Further reinforcing the importance of resistance near 96.00, the 50% retracement of the entire down move from the March 2020 102.99 high to the January 89.20 low is at 96.10.
It will be a surprise if the DXY index doesn't at the very least see a modest retracement from the 96.00/10 resistance zone in coming sessions and, by doing so, allow gold to consolidate its break higher and keep it on track for a test of resistance at $1916.
Aware that should the DXY see a sustained break and close above 96.10/00, it would likely see gold fallback towards interim support near $1800. To protect against this, we suggest tightening stops on our long gold trade idea to break even at $1845.
Source Tradingview. The figures stated areas of November 17th, 2021. Past performance is not a reliable indicator of future performance. This report does not contain and is not to be taken as containing any financial product advice or financial product recommendation
How to trade with City Index
You can trade easily trade with City Index by using these four easy steps:
- Open an account, or log in if you’re already a customer
• Open an account in the UK
• Open an account in Australia
• Open an account in Singapore
- Search for the company you want to trade in our award-winning platform
- Choose your position and size, and your stop and limit levels
- Place the trade
Generally speaking, a lower U.S. dollar and lower yields are supportive of a higher gold price. Last week the breakdown in real yields was a key factor behind our long gold trade suggestion in this article here (long gold at an average of $1845).
Although 10 year real yields have bounced from -117bp to -110bp in recent sessions, resistance is viewed at -100bp, where they broke down from in early November. As such negative real yields are likely to remain supportive of gold in the medium term.
However, should the U.S. dollar continue to power higher, it would be a significant setback to last week's break higher in gold.
Using the U.S dollar index, the DXY, as our barometer for U.S. dollar directionality, after an impressive rally over the past week, the DXY index is currently testing the resistance coming from the top of the upward sloping trend channel near 96.00.
Further reinforcing the importance of resistance near 96.00, the 50% retracement of the entire down move from the March 2020 102.99 high to the January 89.20 low is at 96.10.
It will be a surprise if the DXY index doesn't at the very least see a modest retracement from the 96.00/10 resistance zone in coming sessions and, by doing so, allow gold to consolidate its break higher and keep it on track for a test of resistance at $1916.
Aware that should the DXY see a sustained break and close above 96.10/00, it would likely see gold fallback towards interim support near $1800. To protect against this, we suggest tightening stops on our long gold trade idea to break even at $1845.
Source Tradingview. The figures stated areas of November 17th, 2021. Past performance is not a reliable indicator of future performance. This report does not contain and is not to be taken as containing any financial product advice or financial product recommendation
- Open a Forex.com account, or log in if you’re already a customer.
- Search for the pair you want to trade in our award-winning platform.
- Choose your position and size, and your stop and limit levels.
- Place the trade.



The complete CFD trading experience
Award-winning platforms, competitive spreads, low commissions and dedicated support.
We live and breathe the markets and are dedicated to helping traders realise their ambitions as we continue to set the industry bar.
Economic calendar
Web Trader platform
Our sophisticated web-based platform is packed with features.
Related articles
S&P 500 Forecast: SPX rises after cooler-than-expected inflation data
U.S. stocks are rising and Treasury yields are falling after data showed that inflation increased at a cooler pace than expected, while U.S. consumer spending rose again in August.

EUR/USD forecast: Eurozone stagflation risks mount as dollar holds firm ahead of data
The dollar was bouncing back at the time of writing, after it had eased overnight on the back of some weaker-than-expected economic data yesterday which had prompted markets to scale back expectations of an October Fed rate hike. However, with more significant US data due today and Friday, and with oil prices continuing to remain elevated, the dollar’s broader direction remains bullish.


NZD/USD pressure mounts as payrolls looms large
NZD/USD has fallen sharply as Fed rate expectations reset higher, but extreme downside stretch and major support raise the risk of a violent counter-trend rebound.

StoneX Europe Ltd may make third party material available on this website which may contain information included but not limited to the conditions of financial markets. The material is for information purposes only and does not contain, and should not be construed as containing, investment advice and/or investment recommendation and/or an investment research and/or an offer of or solicitation for any transactions in financial instruments; any decision to enter into a specific transaction shall be made by the client following an assessment by him/her of their situation.
StoneX Europe Ltd makes no representation or warranty and assumes no liability as to the accuracy or completeness of the information provided, nor any loss arising from any investment based on a recommendation, forecast or other information supplied. You should always seek independent advice as to your suitability to speculate in any related markets and your ability to assume the associated risks, if you are at all unsure. We are not under any obligation to update any such material. Any opinion made may be personal to the author and may not reflect the opinion of StoneX Europe Ltd.