



WTI analysis: Crude oil seeking a bottom
In this article, we discuss the factors drove the significant drop in prices and explain why further downside could be limited for crude oil. WTI technical analysis suggests $70 is among key support levels to watch
Share this:

- Crude oil analysis: What factors drove the significant drop in prices?
- Further downside could be limited for crude oil
- WTI technical analysis: $70 among key support levels
With seven consecutive weeks of losses, oil is clearly not in a position to be bullish on in terms of momentum, which means the potential for further short-term weakness is there. Nevertheless, the most severe phase of the market decline might be in the past, following a challenging couple of months. Ongoing supply reductions from OPEC and its allies are expected to restrict further downside. If anything, I am inclined to believe that the risks are tilted towards the upside from this point onwards. But we must see a clearer reversal pattern before turning tactically bullish on oil again.
Crude oil analysis: What factors drove the significant drop in prices?
Despite the rebound observed at the close of the previous week, oil prices ultimately concluded the week with a fall, extending the streak of losses to seven weeks. The latest drop was partly attributed to the voluntary production cuts implemented by OPEC+ a couple of weeks ago, which failed to impress the markets. The sell-off gathered momentum as successive support levels gave way, leading to additional technical selling.
Beyond scepticism about the efficacy of OPEC's recent production cuts, investors have also been troubled by signs of increased non-OPEC supply, as indicated by persistent increases in US crude exports. This is exerting pressure on smaller OPEC+ members to concede more market share as part of their supply reduction agreement. Some members are understandably hesitant to further reduce production, fearing a loss of market share to the US.
On top of the supply-side influences, concerns about demand have also contributed to the recent downturn. The global economy remains sluggish due to elevated interest rates, while the lingering effects of past inflation spikes continue to adversely impact both consumers and businesses. The gradual disinflationary process exacerbates these challenges.
Further downside could be limited for crude oil
Despite the economic challenges, the substantial decline in oil prices may not be entirely warranted, considering the inelastic nature of oil prices in response to demand fluctuations. In this context, the predominant influence lies on the supply side of the equation. Therefore, should the OPEC decide to implement further measures to stabilise prices, it could serve as a significant pillar of support. Recent statements from officials in Saudi Arabia and Russia hint at the potential extension or deepening of supply cuts beyond the first quarter.
Even without additional cuts from OPEC+, they are already making significant efforts in terms of supply restraint. As demand recovers, prices are likely to find support again. One could argue that the extent of the sell-off is already questionable given the ongoing intervention by OPEC+ group.
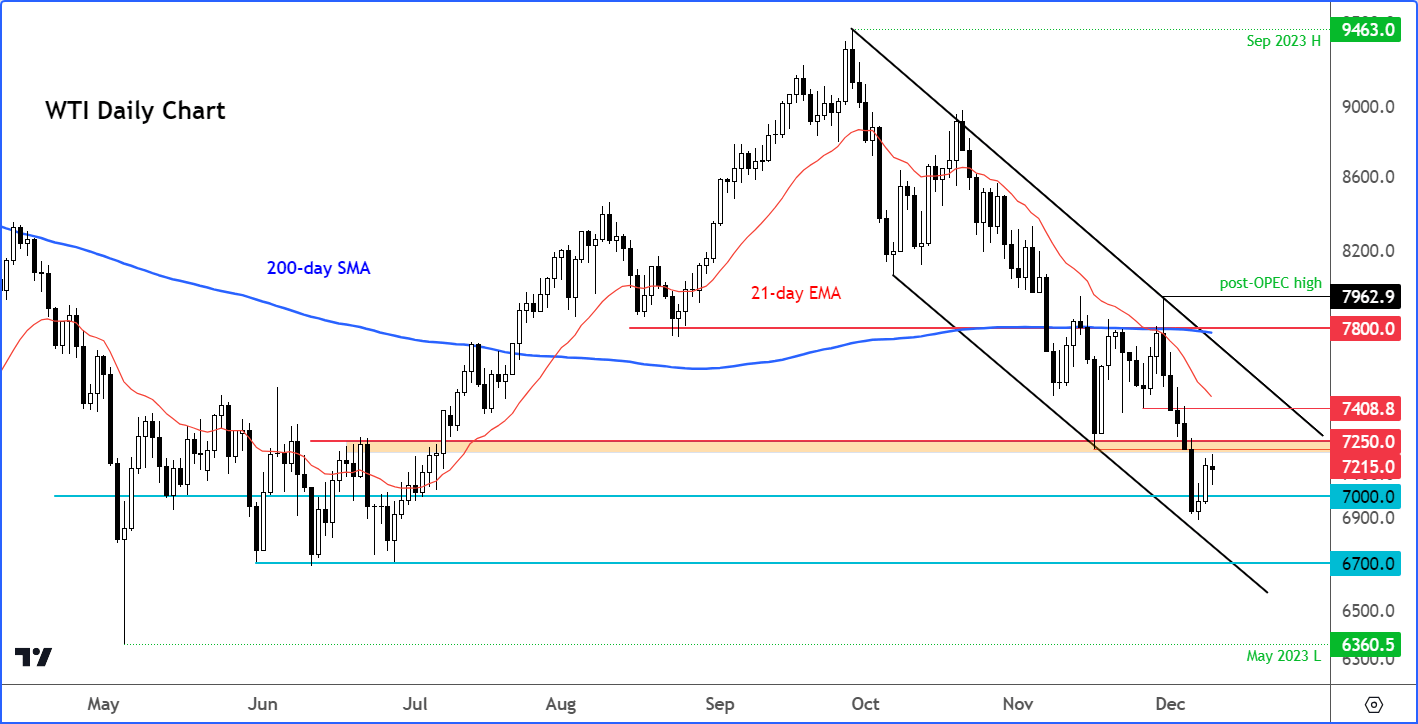
WTI analysis: Technical levels to watch on crude oil
Source: TradingView.com
Since reaching its peak at $95.00 in September, WTI has experienced a persistent downward trend. Oil prices declined in both October and November and have continued to do so this month. With only two positive weeks in the last 12, and 7 consecutive weekly losses, the prevailing momentum is unmistakably bearish. Therefore, before adopting a tactical bullish stance on oil prices, it is imperative to await a confirmed reversal pattern, despite tentative indications of a potential bottom observed at the end of last week. During that period, prices found support, as we saw a brief dip below $69 before recovering to conclude the week well above the $70 mark.
Looking ahead, the $70.00 level is the key level of support to monitor. Beyond its psychological importance, $70 served as the foundation for the last significant rally in July and aligns with the support trend of the bearish channel. This dual role underscores its critical nature as a potential support zone where prices might find a bottom. Below this level, $67 becomes the next reference point, followed by $65 and the May low at $63.64. We will cover these levels if $70 breaks.
In terms of resistance, the range between $72.35 to $74.00 constitutes a crucial zone. This area previously acted as support before the breakdown last week. Thus, a successful recapture of this key zone by the bulls would significantly raise the likelihood of a near-term bottom. However, a clean breakout from the bearish channel would be ideal for additional confirmation.
-- Written by Fawad Razaqzada, Market Analyst
Follow Fawad on Twitter @Trader_F_R
How to trade with City Index
You can trade with City Index by following these four easy steps:
- Open an account, or log in if you’re already a customer
• Open an account in the UK
• Open an account in Australia
• Open an account in Singapore
- Search for the company you want to trade in our award-winning platform
- Choose your position and size, and your stop and limit levels
- Place the trade
Related tags:
Latest market news




The complete CFD trading experience
Award-winning platforms, competitive spreads, low commissions and dedicated support.
We live and breathe the markets and are dedicated to helping traders realise their ambitions as we continue to set the industry bar.
Economic calendar
Web Trader platform
Our sophisticated web-based platform is packed with features.
Related articles
S&P 500 Forecast: SPX rises as oil prices fall, but treasuries remain at multi-decade highs
U.S. stocks are rising on Friday after a volatile week that saw a surge in Treasury yields ripple through financial markets.

Oil Quietly Hands the Fed a Reason to Stay Hawkish
Oil prices and the U.S. dollar are both on the front foot as elevated energy costs feed Fed warnings that inflation may prove sticky.

S&P 500 forecast: Stocks extend drop as correction risks grow
US and global equity markets have extended Wednesday’s sell-off, with Wall Street opening lower after a weak handover from Asia and Europe. The deterioration in risk appetite has been spreading across global markets. The dollar was firmer, Treasury yields were holding onto yesterday’s gains, while gold, silver and bitcoin were all under pressure alongside equities and major currencies.
StoneX Europe Ltd may make third party material available on this website which may contain information included but not limited to the conditions of financial markets. The material is for information purposes only and does not contain, and should not be construed as containing, investment advice and/or investment recommendation and/or an investment research and/or an offer of or solicitation for any transactions in financial instruments; any decision to enter into a specific transaction shall be made by the client following an assessment by him/her of their situation.
StoneX Europe Ltd makes no representation or warranty and assumes no liability as to the accuracy or completeness of the information provided, nor any loss arising from any investment based on a recommendation, forecast or other information supplied. You should always seek independent advice as to your suitability to speculate in any related markets and your ability to assume the associated risks, if you are at all unsure. We are not under any obligation to update any such material. Any opinion made may be personal to the author and may not reflect the opinion of StoneX Europe Ltd.