



Bitcoin Tests Support as Gold Rally Falls Flat, Falls to FOMC Lows
Surging yields and higher rate hike odds present a new wrinkle for markets, and this has softened the trend in gold. Bitcoin, meanwhile, has retained strong bullish structure and continues to show a brighter backdrop than XAU/USD.
Share this:

Gold, BTC/USD Talking Points:
- The past two weeks are non-ideal environments for non-yielding assets like gold and Bitcoin. Treasury yields are surging and even though stocks have held up relatively well so far, there’s less reason for buyers to hit the bid in markets like XAU/USD or BTC/USD.
- Nonetheless, Bitcoin set a fresh high earlier this week, even as gold prices remain on their back foot.
When a market should go down but doesn’t, something is up, and that something could be impactful for what lies ahead than what we already know. That’s the story in Bitcoin right now as the rally is now more than a month old following the massive breakout triggered by the larger Treasury buyback announcement from Scott Bessent. Interestingly, gold had already broken out at that point and the announcement provided a similar bullish prod, although it was lesser in gold than BTC.

But while gold topped shortly after that move, Bitcoin has continued to power higher, even in a backdrop that usually wouldn’t be supportive of such. With US yields surging and continuing that run today, going along with a more hawkish FOMC, gold has continued to draw down. But Bitcoin has just continued to rally.
And even at this point there’s a clear disparity as gold is down for a test of the FOMC lows while Bitcoin is testing a major spot of support.
Gold Re-Tests FOMC Lows, Daily Chart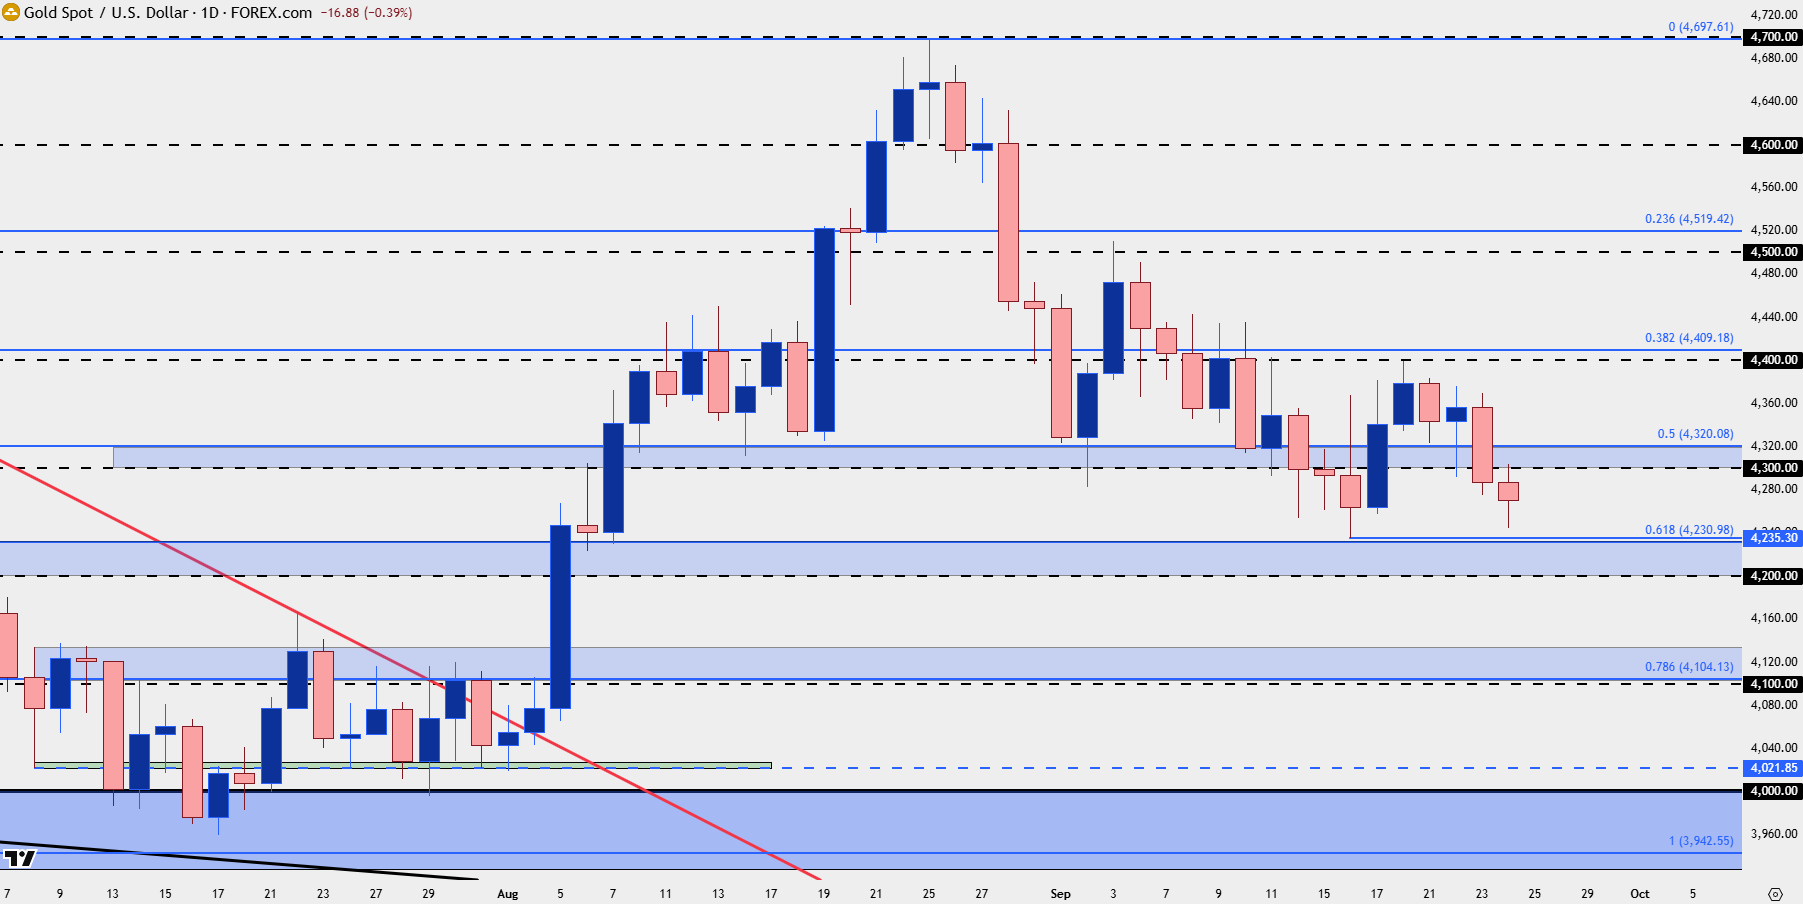
Chart prepared by James Stanley; data derived from Tradingview
Gold Descending Triangle
While it’s not too late at this point, given that we have seen the sell-off stall above last week’s low, which goes along with a green weekly bar from last week for gold, there is a bearish setup in the metal right now that could be justified for a break and test of fresh lows.
The lower highs over the past three weeks are meaningful, especially with last week’s hold at 4400 and this week’s hold at 4360. While horizontal support isn’t as solid as one would prefer for such formations, the fact that sellers have gotten increasingly more aggressive on bounces highlights that, eventually, that support could give way and that points to a push towards the 4100 zone, which was resistance back in July before the post-FOMC breakout.
Gold Four-Hour Chart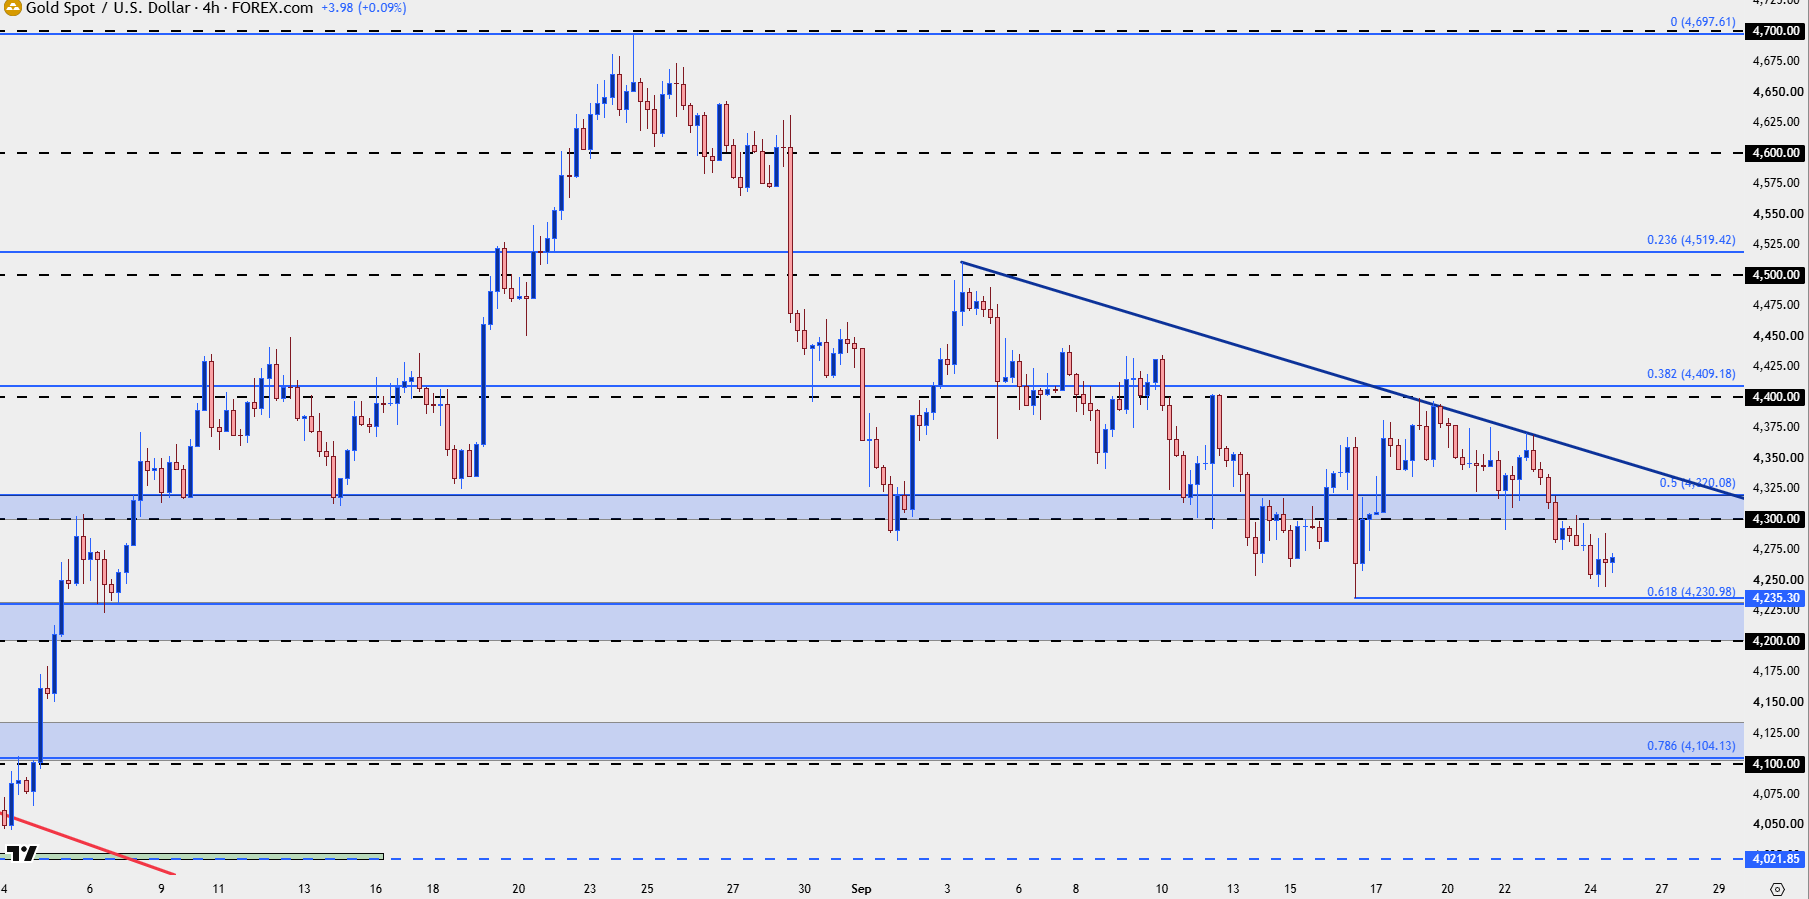
Chart prepared by James Stanley; data derived from Tradingview
Bitcoin
There have been multiple prior periods where Bitcoin has outperformed gold, as if the world’s preference for an anti-fiat vehicle suddenly shifted. I talked about this in the article yesterday, highlighting specific periods in 2020 and 2024 where gold slumped and Bitcoin broke out in a very big way.
That’s started to happen again, and even as gold has slid from the highs after that pop from the Treasury buyback announcement, Bitcoin has continued to gain ground with another fresh high posting earlier this week.
So far, there’s been a three-day pullback from that high and at this point, BTC/USD is testing a big spot of support as taken from prior resistance – the same swing that set the high back in May of this year.
BTC/USD Daily Chart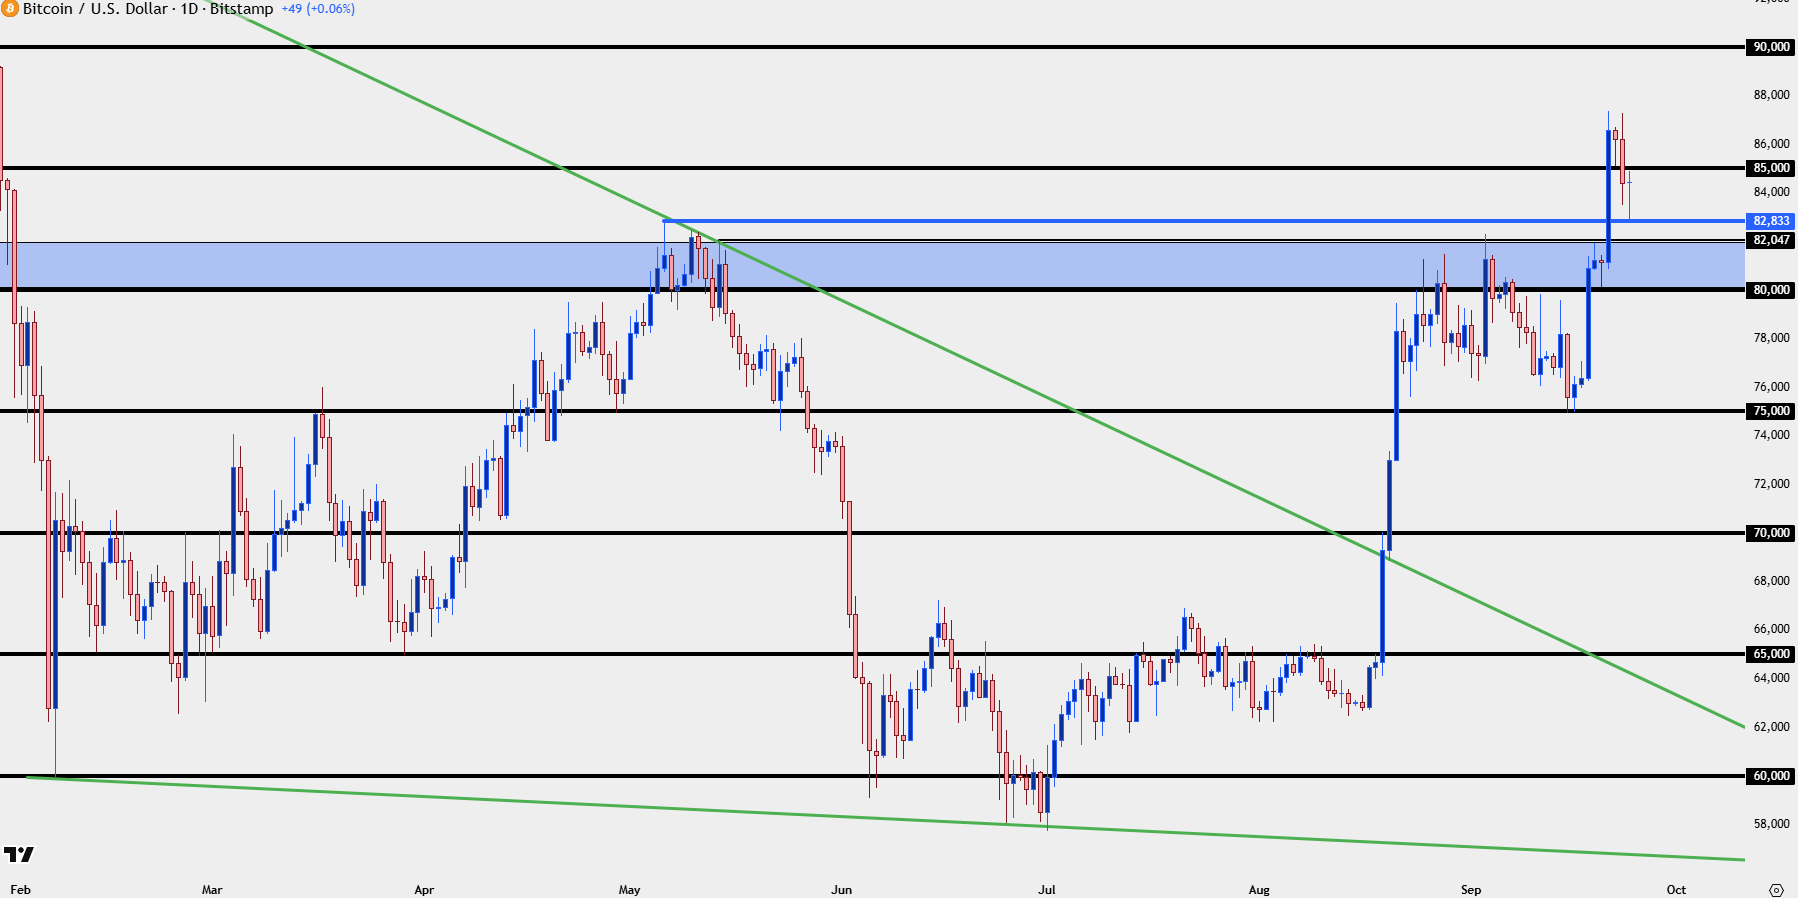
Chart prepared by James Stanley; data derived from Tradingview
--- written by James Stanley, Senior Market Analyst, Global Macro
Related tags:



The complete CFD trading experience
Award-winning platforms, competitive spreads, low commissions and dedicated support.
We live and breathe the markets and are dedicated to helping traders realise their ambitions as we continue to set the industry bar.
Economic calendar
Web Trader platform
Our sophisticated web-based platform is packed with features.
Related articles

Bitcoin Analysis: Is Uncertainty Returning to BTC?
Recent trading sessions have not been particularly supportive of a clear directional move in Bitcoin. This can be seen in the behavior of the price over the last four sessions, where fluctuations have remained close to 1.00% without establishing a consistent trend. As a result, a growing sense of neutrality is beginning to emerge around BTC.


Japanese Yen Technical Analysis: USD/JPY Support Test into Core PCE
USD/JPY has been a battlefield for the past two months as the force of intervention and the threat of more have given sellers an advantage, even as buyers have continued to bid support on pullbacks. This sets the stage for a massive finish to the week with Core PCE and Non-farm Payrolls.

Euro Forecast: EUR/USD Tumbles Towards Yearly Low as Daily RSI Goes Oversold
EUR/USD has been hit hard in the final month of the quarter as USD strength has shown up in a big way. With the pair set to challenge its yearly low as RSI has pushed into oversold territory, is there a chance for a pullback with some big headline risk hitting in the US over the next few days?
StoneX Europe Ltd may make third party material available on this website which may contain information included but not limited to the conditions of financial markets. The material is for information purposes only and does not contain, and should not be construed as containing, investment advice and/or investment recommendation and/or an investment research and/or an offer of or solicitation for any transactions in financial instruments; any decision to enter into a specific transaction shall be made by the client following an assessment by him/her of their situation.
StoneX Europe Ltd makes no representation or warranty and assumes no liability as to the accuracy or completeness of the information provided, nor any loss arising from any investment based on a recommendation, forecast or other information supplied. You should always seek independent advice as to your suitability to speculate in any related markets and your ability to assume the associated risks, if you are at all unsure. We are not under any obligation to update any such material. Any opinion made may be personal to the author and may not reflect the opinion of StoneX Europe Ltd.