
The trading week continues to unfold and weakness around the euro has once again become increasingly evident in the short term. This can be seen in the recent performance of EUR/USD, which has declined roughly 0.3% over the last three trading sessions, highlighting renewed strength in the U.S. dollar.
For now, selling pressure on the euro remains supported by the latest U.S. inflation data, which has reinforced expectations of a potentially more aggressive Federal Reserve in the coming months. This development has brought renewed focus to the dollar and could continue supporting downside pressure on EUR/USD as markets adjust their expectations regarding U.S. monetary policy.

Inflation Data Day Arrives
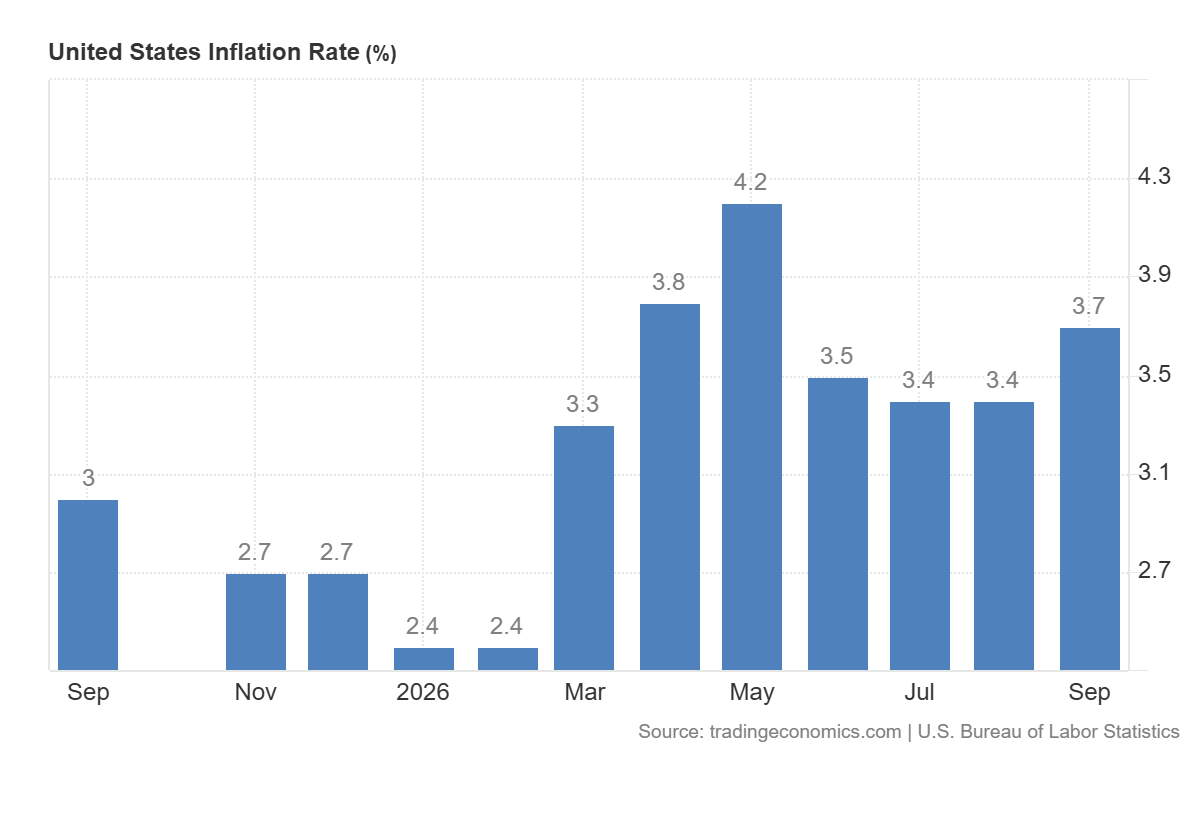
The latest U.S. inflation figures were released today. Annual CPI came in at 3.7%, above the 3.6% expected by the market, while Core CPI, which excludes more volatile components, reached 2.6% compared with expectations of 2.5%.
The key takeaway from this release is that it highlights an inflationary trend that had not been seen for several months. Inflation has resumed an upward trajectory and remains well above the Federal Reserve's 2.0% target. As a result, these figures could reinforce concerns that inflationary pressures remain persistent and support the need for a restrictive monetary policy stance for longer.
Source: TradingEconomics
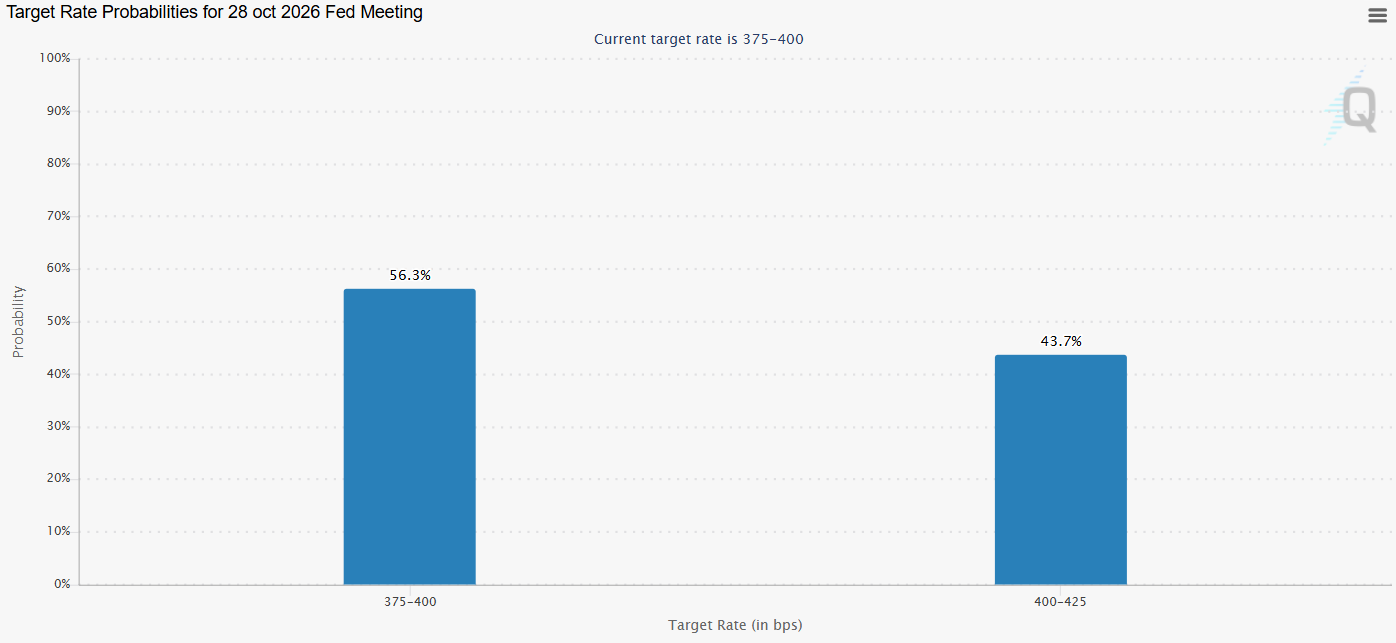
The market reaction was quick to emerge. Following the inflation release, investors began reassessing the probabilities surrounding the Federal Reserve's next decision. The probability of a rate increase toward 4.25% at the October 28 meeting has now risen to around 43%, while the probability of rates remaining unchanged has declined to approximately 56%.
This shift is particularly relevant considering that only a few days ago the no-change scenario carried a probability well above 70%. The adjustment reflects a market that is beginning to price in a more aggressive Federal Reserve than it expected just weeks ago and is a direct response to inflation data that continues to show limited signs of easing.
Source: CMEGROUP
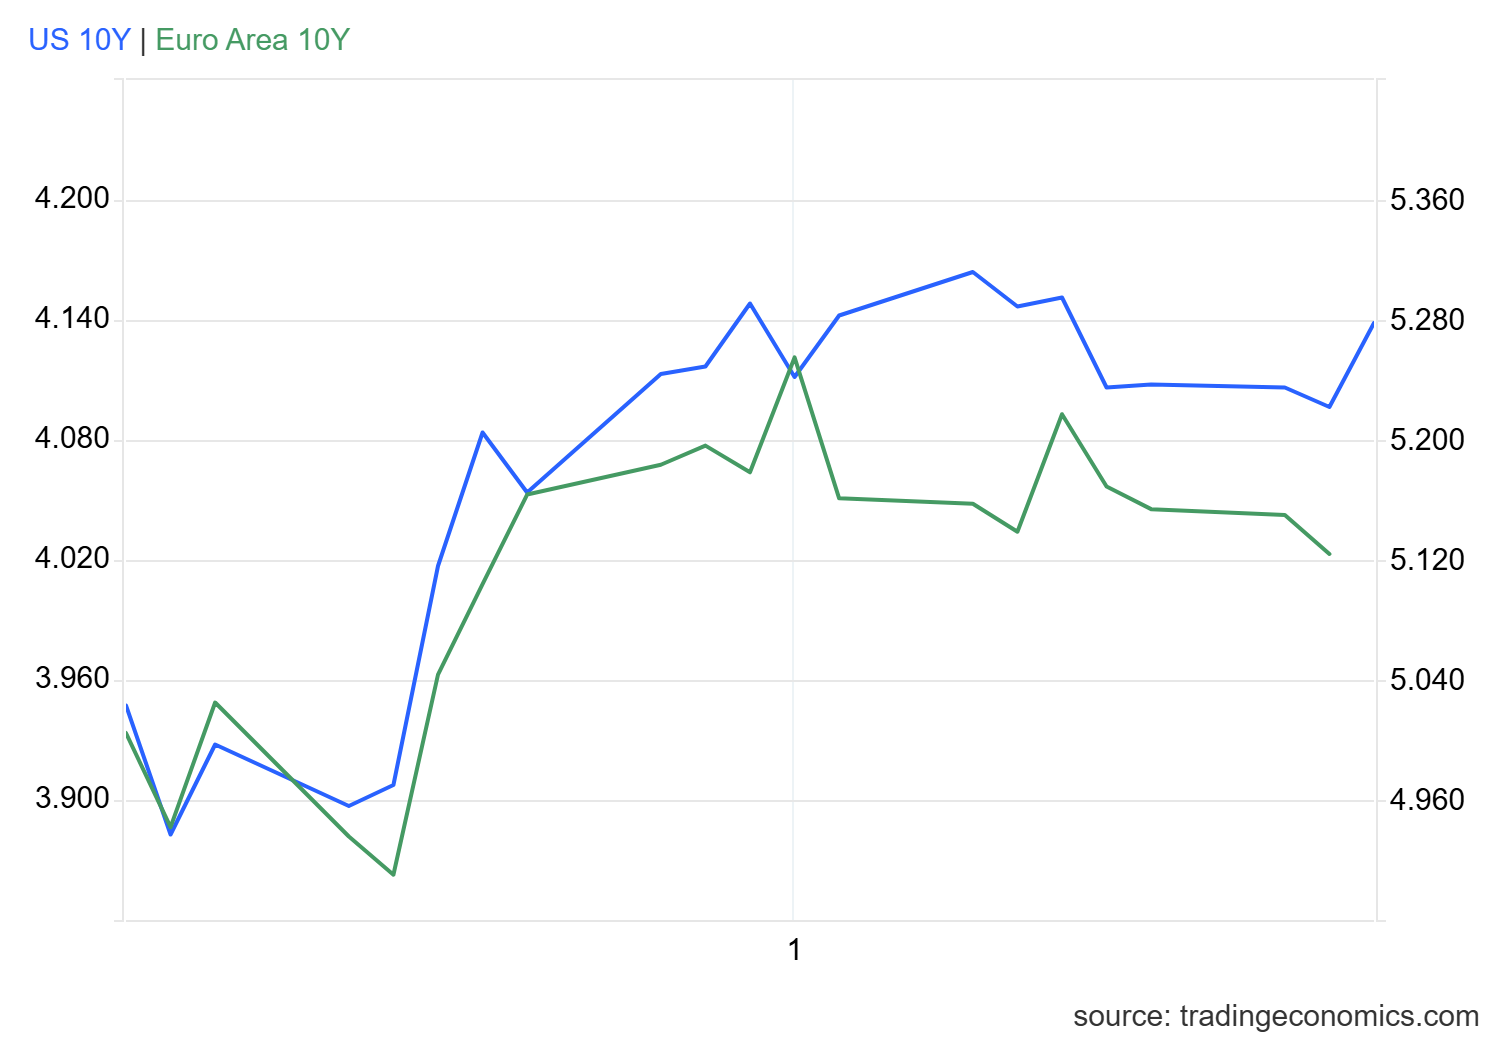
This sequence of events has also brought renewed strength to the U.S. bond market. Following the inflation release, 10-year Treasury yields moved back toward the 5.3% area, levels not seen in decades and a clear indication of the renewed attractiveness of U.S. fixed-income assets.
The comparison with Europe remains important. While U.S. yields continue to strengthen, 10-year European bond yields remain close to the 4.0% area and continue to show a softer trend in recent sessions. This yield differential continues to favor dollar-denominated assets and could keep attracting capital toward the United States, limiting demand for euro-denominated investments.
Source: TradingEconomics
Taking all of this into account, the latest inflation data has not been favorable for the euro in the short term. The stronger figures have reinforced expectations of a more restrictive Federal Reserve, supporting higher U.S. yields and renewed demand for dollars.
As long as this dynamic remains in place, the euro could continue struggling to regain ground consistently, allowing selling pressure around EUR/USD to remain an important theme in the sessions ahead.
EUR/USD Technical Forecast
Source: StoneX, Tradingview
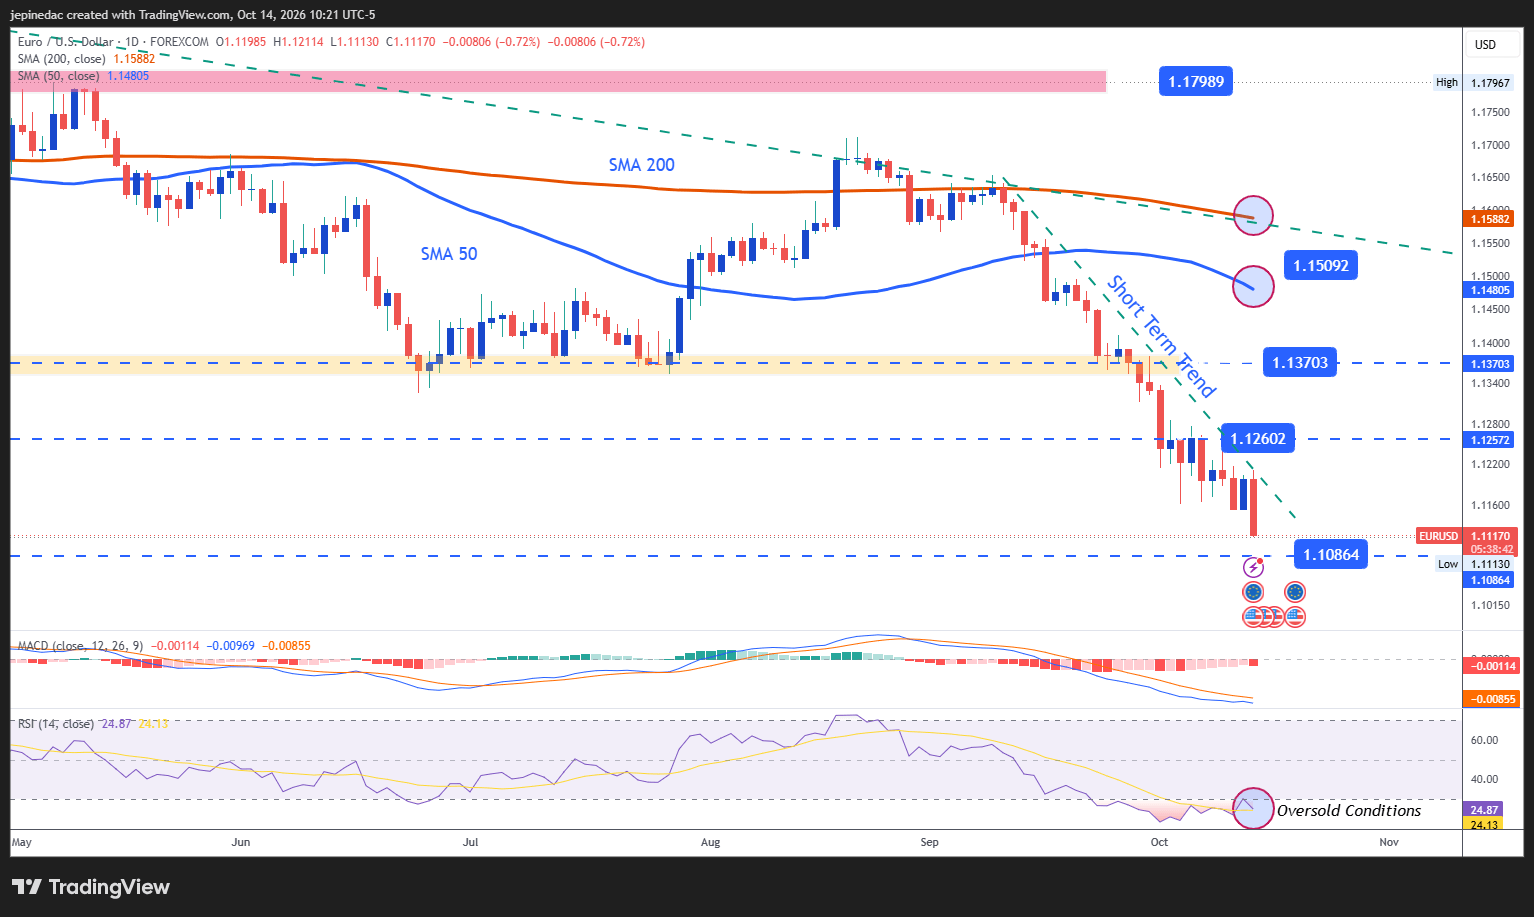
- The bearish trendline continues to gain momentum: Since January 2026, an important bearish trendline has been developing on the EUR/USD daily chart, dominating much of the price action observed in recent months. However, selling pressure has intensified in recent weeks, giving rise to a steeper short-term bearish trendline that now stands as the market's most relevant technical structure. As long as this dynamic remains intact, the broader bearish structure could continue strengthening in the weeks ahead.
- MACD: The MACD histogram continues to move closer to the 0 neutral line, reflecting that short-term moving-average momentum remains relatively balanced. This reading suggests that while the bearish bias remains dominant, a degree of indecision is still present within the market.
- RSI: A different picture can be observed in the RSI, which remains below the 30 oversold threshold. This reading highlights the intensity of the recent selling pressure and suggests that short-term technical rebounds could begin to emerge in the coming sessions.
Key Levels:
- 1.13703 – Key Resistance: This level coincides with an important support area that was broken several weeks ago and now acts as the chart's primary upside barrier. Price action returning toward this level could begin to reduce recent selling pressure and support a more neutral market environment, potentially opening the door to a broader consolidation phase.
- 1.12602 – Near-Term Barrier: A level that aligns with an important retracement zone observed over recent weeks and could become the primary reference to monitor in the event of short-term bullish corrections.
- 1.10864 – Major Support: A level not seen since May 2025 that remains the most important downside barrier within the current market structure. Sustained moves toward this area could reinforce the dominant bearish bias and open the door to a more aggressive extension of the current downtrend over the coming weeks.
Written by Julian Pineda, CFA, CMT – Market Analyst
Follow him on: @julianpineda25