
The 1.1500 level held two different tests in EUR/USD in the month of November but the pair still hasn’t been able to break up to a higher-high, with this morning showing yet another recoil away from key resistance. Short-term structure can be construed as bullish but the big question is whether the lower-highs that have built since the FOMC rate cut in September can get negated with a push up to the 1.1700 handle.

Well it was an eventful first half of the year for EUR/USD, and as we came into 2025 few probably would’ve expected the strength that would show in the pair. Yearly forecasts seemed to question how deep EUR/USD was drive below parity rather than if it would happen at all, and ironically enough, it was about two weeks into the New Year that the pair set its low and now eleven months later prices are about 1300 pips higher.
The bulk of that gain posted before the Q3 open, however, and for the past five months, it’s been a game of give and take, with neither side of the pair being able to show much for longer-term trends. Sellers took a shot in July – but that snapped back quickly on August 1st after the release of Non-farm Payrolls. Bulls then took a shot into the highly-expected rate cut from the Fed, setting a fresh three-year high right around that announcement; but since then, it’s been lower-lows and lower-highs.
The weekly chart of EUR/USD illustrates this contrast well, where the smooth-running rally from H1 led into the grind and gyration of Q3 and now, Q4.
EUR/USD Weekly Chart
Chart prepared by James Stanley; data derived from Tradingview
EUR/USD 1.1500
The current stumbling block for trends in both the USD and EUR/USD pair seem linked, as the 1.1500 handle in EUR/USD has been a barrier for bears and the 100-100.22 zone a brick wall for bulls in DXY. That 100.22 level was support last year in Q3 right around the Fed’s first rate cut of that cycle, and so far this year, it’s held resistance in the Dollar multiple times, including for five consecutive days into last week.
On the driver side, it’s interesting how USD posted higher-highs and lows and EUR/USD lower-lows and highs since the Fed’s rate cuts began, and this mirrors last year when the Dollar stalled after the first rate cut announcement and then rallied aggressively through the Q4 open. The main difference, of course, is that any USD rallies have been somewhat restrained compared to last Q4 and this begs the question as to whether there’s a factor that can change that, namely inflation data.
With the FOMC now in the blackout window we’re just a week and a half away from another Fed meeting and market expectations are high for another cut. But this is a quarterly rate decision so we’ll also be getting updated guidance and projections and this would provide some additional backdrop for trends, in one direction or the other.
On the part of EUR/USD, however, there’s the possibility that bulls make a run for it before we ever get to the FOMC meeting. At this point, there’s still bearish structure on the daily as taken from the lower-lows and lower highs that have built over the past two and a half months, but the lower-highs from late-October and early-November are already nearby from 1.1656-1.1669. That zone came very close earlier this morning and so far buyers have shied away from a test, but that does leave bullish short-term structure in-place that I’ll look at below.
EUR/USD Daily Chart
Chart prepared by James Stanley; data derived from Tradingview
EUR/USD Short-Term
I’ve been talking about that 1.1500 level as the key zone of support in EUR/USD for some time now. In early-November, as bears were initially re-testing it, I cautioned against chasing the breakdown. Prices snapped back but held below the prior lower-high at 1.1669, leaving a lower-high at 1.1656.
And then two weeks ago, bears were back at it, taking another shot at driving the trend and, again, they stalled at the 1.1500 handle but this time, it led to a higher-low from the early inflection point in November.
In the past two webinars I’ve looked into this closely, with focus on the 1.1542 level and then the 1.1593-1.1600 zone; the former which began higher-low support last week as bulls have attempted to drive short-term trends while so far falling short.
This puts emphasis on the 1.1593-1.1600 zone as short-term support, as a hold there keeps the door open for a push into the 1.1656-1.1669 zone. If buyers fail, and prices dip below 1.1593, then the focus is on the familiar 1.1542-1.1550. At that point, it’ll appear like buyers have failed to hold control of the short-term rally and that ‘ll start to open the door for another re-test of the 1.1500 handle.
That major psychological level can often take time to give way and we may be in one of those periods, where longer-term supports are pushing shorter-term trends. But, through it all, structure remains important and this can be a guiding driver for strategy.
EUR/USD Four-Hour Chart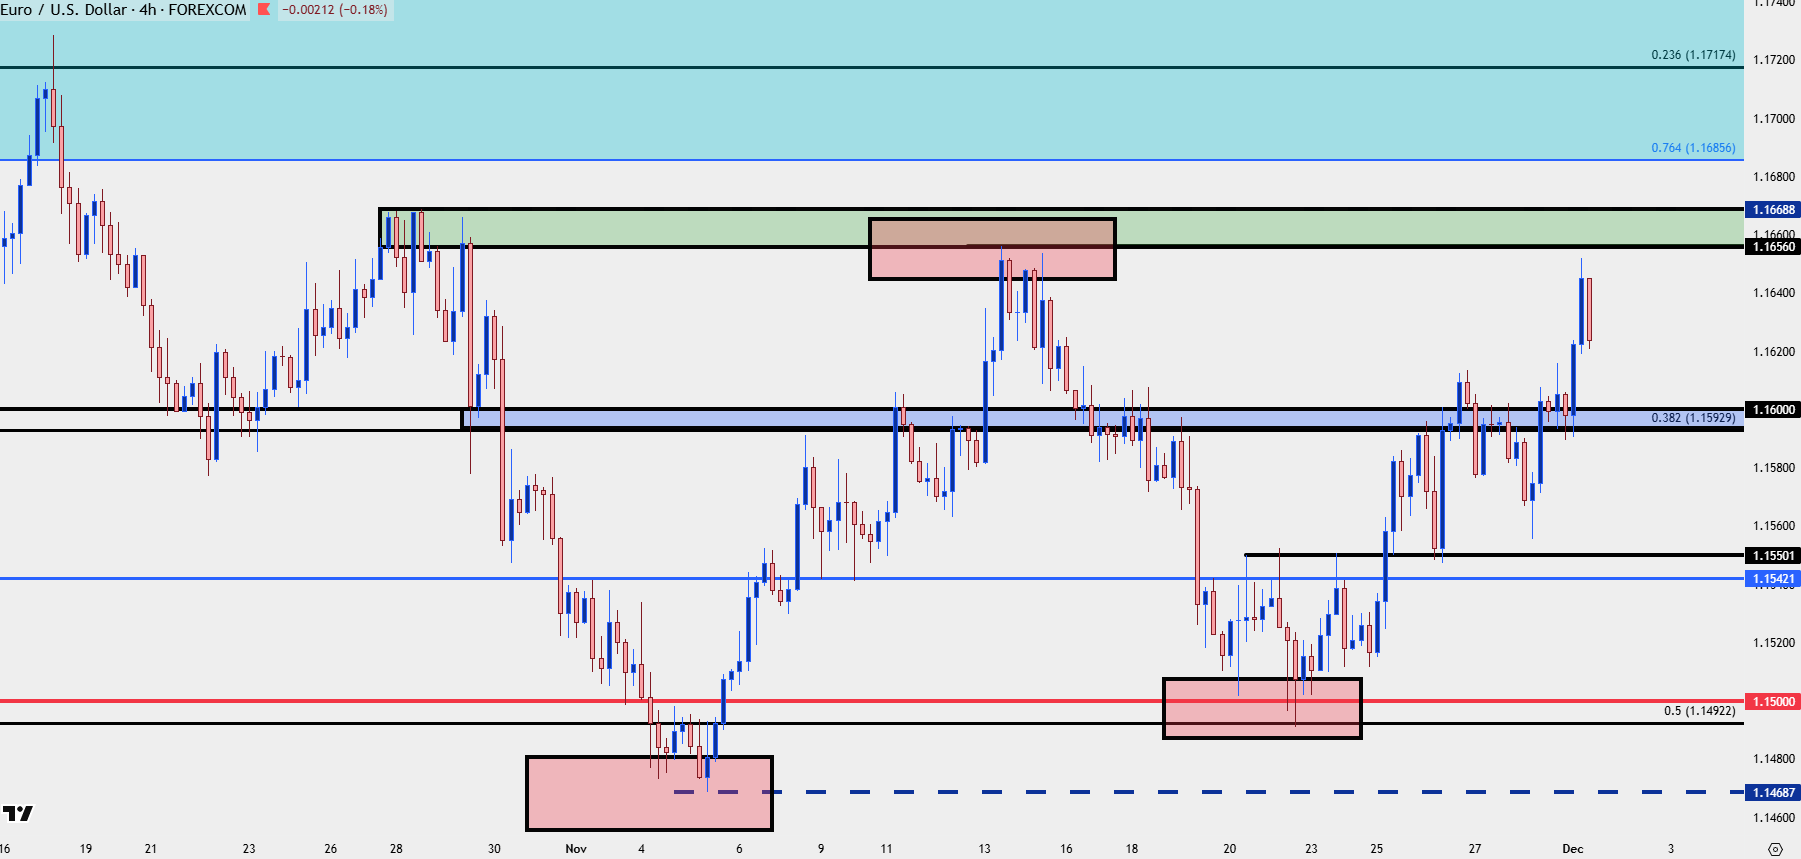
Chart prepared by James Stanley; data derived from Tradingview
--- written by James Stanley, Senior Market Analyst, Global Macro