
It was a pull back week in the USD as the key resistance zone held again, but given the bearish drivers of building expectations for a rate cut along with the possible successor at the Fed, the still-bullish structure on the daily chart stands out as we move towards the FOMC rate decision in two weeks.
US Dollar
As we move towards the November close it’s now been for practically the entire month that resistance has held at prior support. The 100-100.22 zone was in-play just a few days into November trade, with the first test producing a pullback to 98.98 which buyers responded to. But the second test saw five consecutive days of grinding at 100.22, the same low from when the Fed started cutting rates last year.
US Dollar Weekly Chart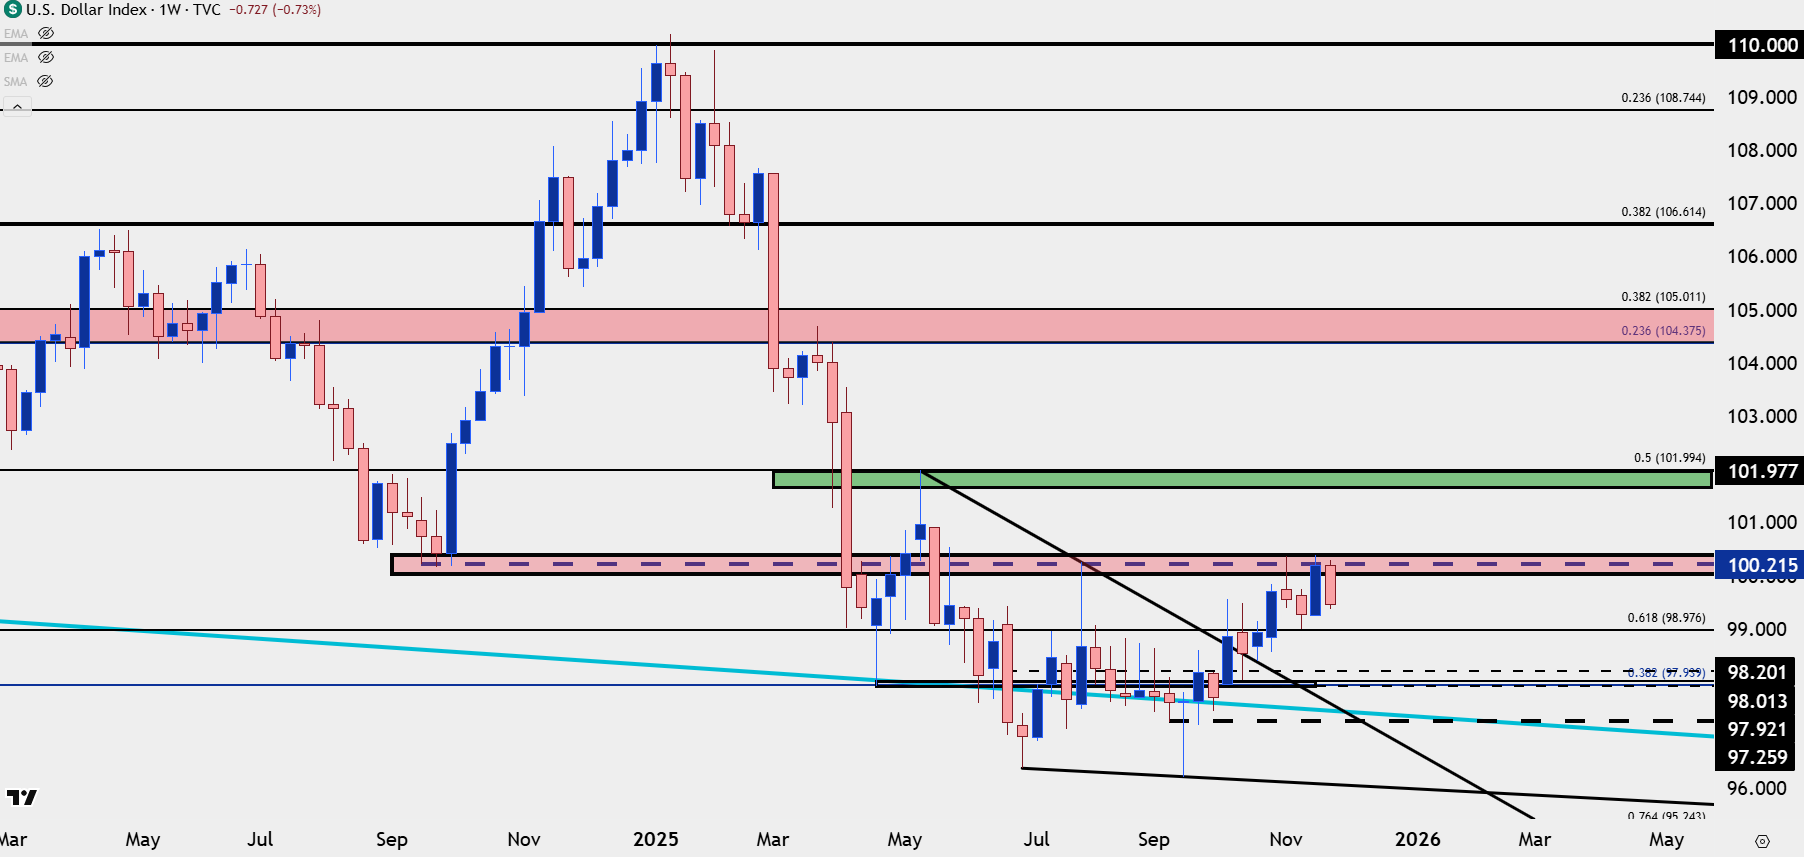
Chart prepared by James Stanley; data derived from Tradingview
USD Daily Chart
From the daily chart there remains bullish structure as the November resistance at 100.22 led to a higher-low in the middle of the month at 98.98; and so far, the current pullback from the second test of that resistance zone has also held support at prior resistance, taken from June highs of 99.33 up to the October high of 99.56.
The cup and handle formation from the daily chart is still in play, as is the falling wedge from the weekly chart that gave way to breakout in October trade.
US Dollar Daily Chart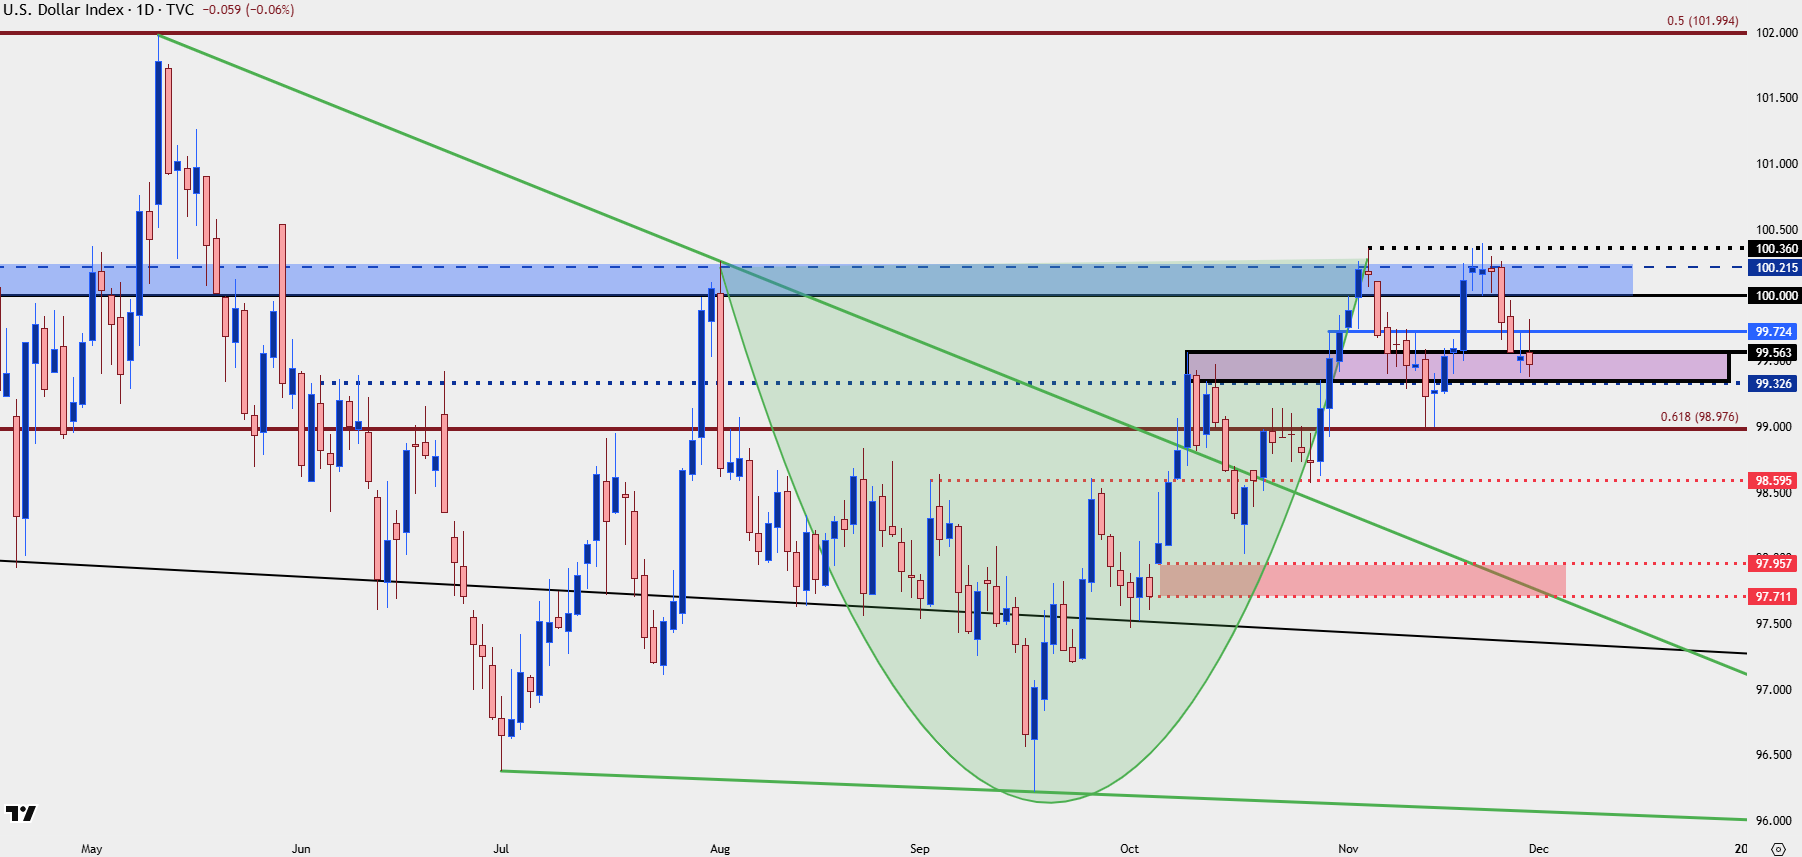
Chart prepared by James Stanley; data derived from Tradingview
USD into FOMC
This Saturday marks the start of the Fed’s blackout window and markets are already highly-expecting another rate cut from the FOMC in two weeks. But, as we’ve seen this year, there’s been a generally bullish response in DXY to FOMC rate meetings. And just a couple of weeks ago the odds for a December rate cut were basically a coin flip, so the heavy pricing in of another move of softness hasn’t yet been able to breach that bullish structure that’s built since the Fed started cutting rates now more than two months ago.
Perhaps more to the point, even as the Fed’s been cutting they’ve been urging caution, calling prior moves ‘a risk management rate cut,’ and then Powell refusing to commit to another cut at the move on October 29th, which helped to spur a series of lower-lows and highs in equities.
From the below chart, I’ve drawn vertical lines around FOMC meetings going back to the beginning of last year, and notice how, even with the Fed in a net cutting posture, especially of late, there’s been a proclivity towards USD-strength at or around those meetings. To be sure, there have been other factors to come into play to reverse those moves, such as Trump threatening to fire Jerome Powell or such as we saw in June, Michelle Bowman saying she was ready to cut rates in July which reversed a post-FOMC rally in DXY to ultimately bring on a fresh low in day one of Q3.
US Dollar Daily Price Chart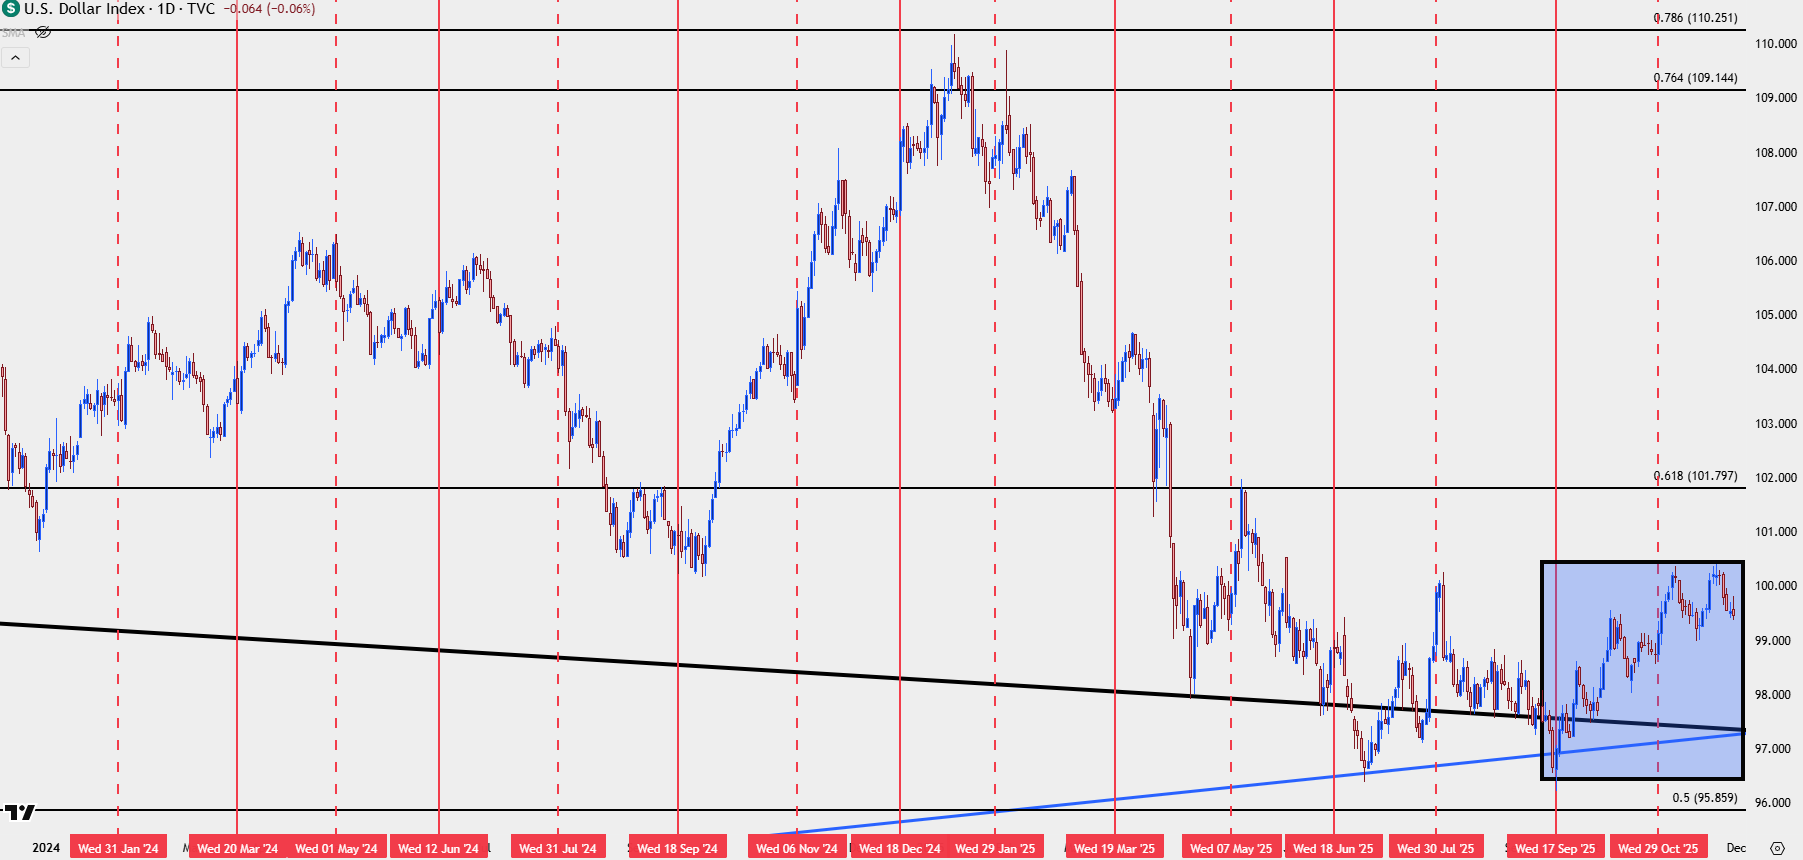
Chart prepared by James Stanley; data derived from Tradingview
EUR/USD
An important factor of consideration for the US Dollar is that DXY is really just a basket of underlying currencies, so there’s more than just the direct matter of US economic fundamentals. And as I’ve been saying for weeks, if the USD rally is going to take-hold, it’s going to need some help from other currencies, such as the Euro, with an extra push of weakness.
In EUR/USD, it’s the 1.1500 level that looms large for that effect and as I looked at last Friday, that support hasn’t yet shown signs of giving way. Bulls haven’t exactly taken over at this point as the daily chart shows still bearish structure, but this sets up an important test at the 1.1656-1.1669 area, which are the lower-highs from late-October and early-November.

If we see that zone hold without testing, the door remains open for both USD bulls and Euro bears – but if it breaches, we have to begin considering failure in the USD rate cut rally that started in September.
With that said, if looking for USD-weakness, there may be a more amenable pasture elsewhere, which I’ll look into next.
EUR/USD Daily Chart: 1.1500 Support Hold So Far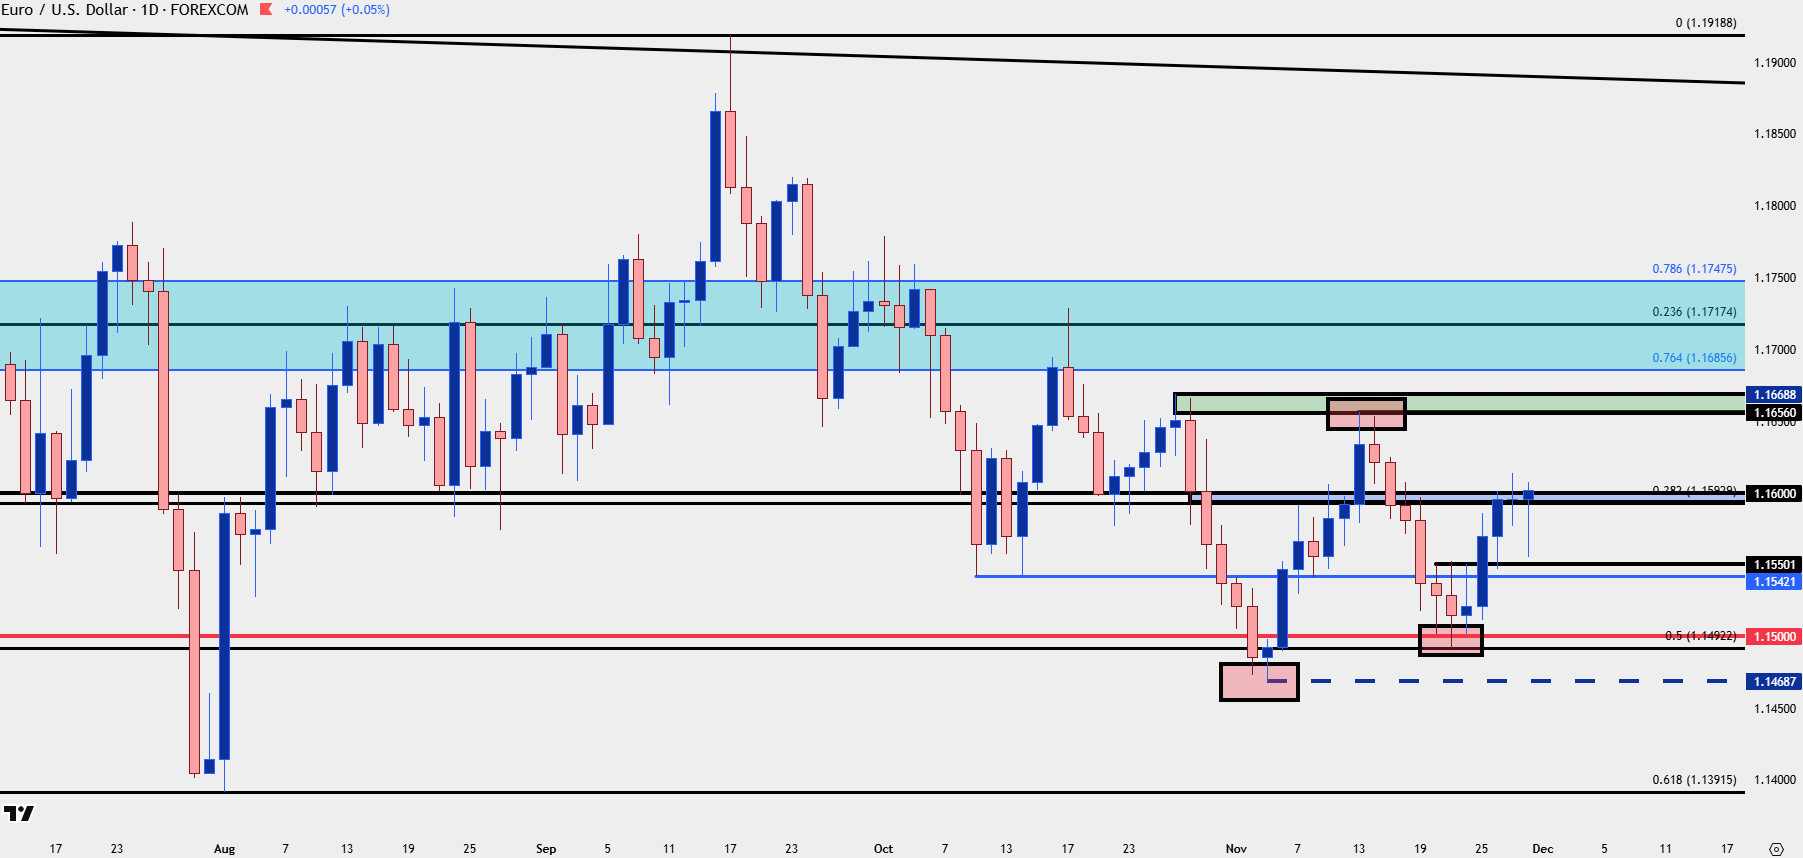
Chart prepared by James Stanley; data derived from Tradingview
GBP/USD
While EUR/USD is currently below the mid-November lower-high, GBP/USD is above it’s own swing high from the middle of the month. This illustrates more attractive bullish structure and this is a far cry from the setup I looked at in the webinar earlier in November as USD was initially testing the 100.22 level.
At the time, GBP/USD was at its most oversold in more than two years. Price had stalled just before a test of the 1.3000 handle, and as I looked at a week later, this had begun to lead in to a stronger bullish backdrop, which has continued to play out.
At this point, prior support of 1.3250 has come in to hold the high over the past two days so we have a case of resistance from prior support. This highlights support structure, as looked at in last week’s webinar, at 1.3186, 1.3140 and the 1.3100-1.3117 zone.
GBP/USD Daily Price Chart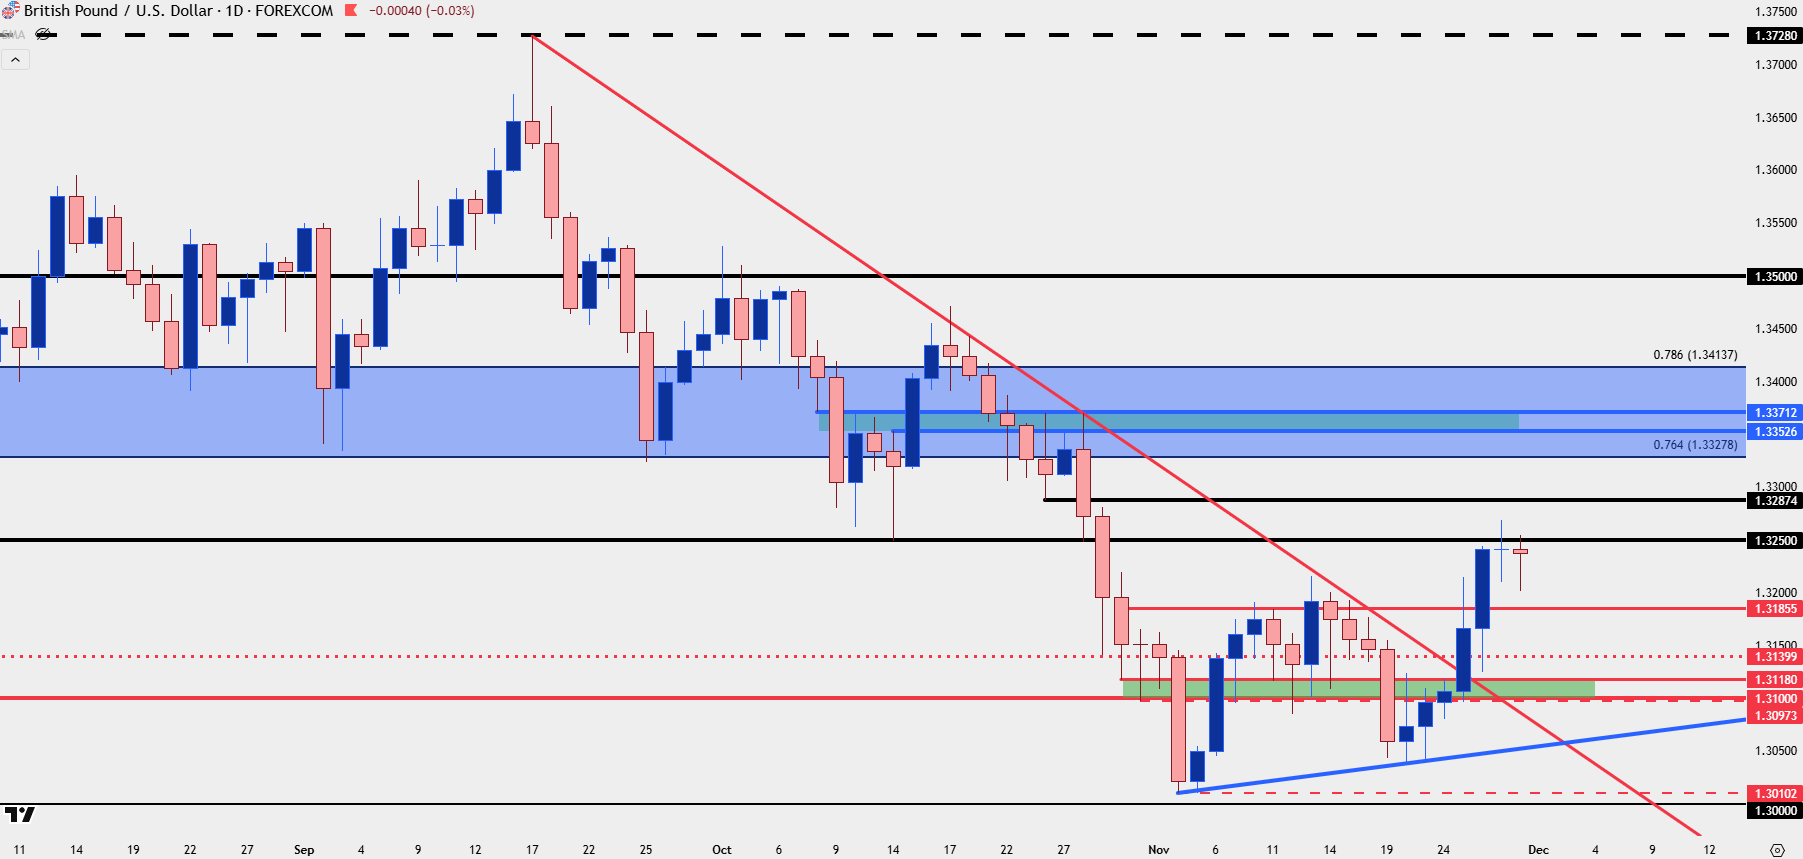
Chart prepared by James Stanley; data derived from Tradingview
USD/JPY
For USD-strength I still think that USD/JPY is the most attractive venue. The weekly chart presents a bit of challenge on that front, however, as pullbacks have remained light and we’re currently looking at an inside bar.
USD/JPY Weekly Price Chart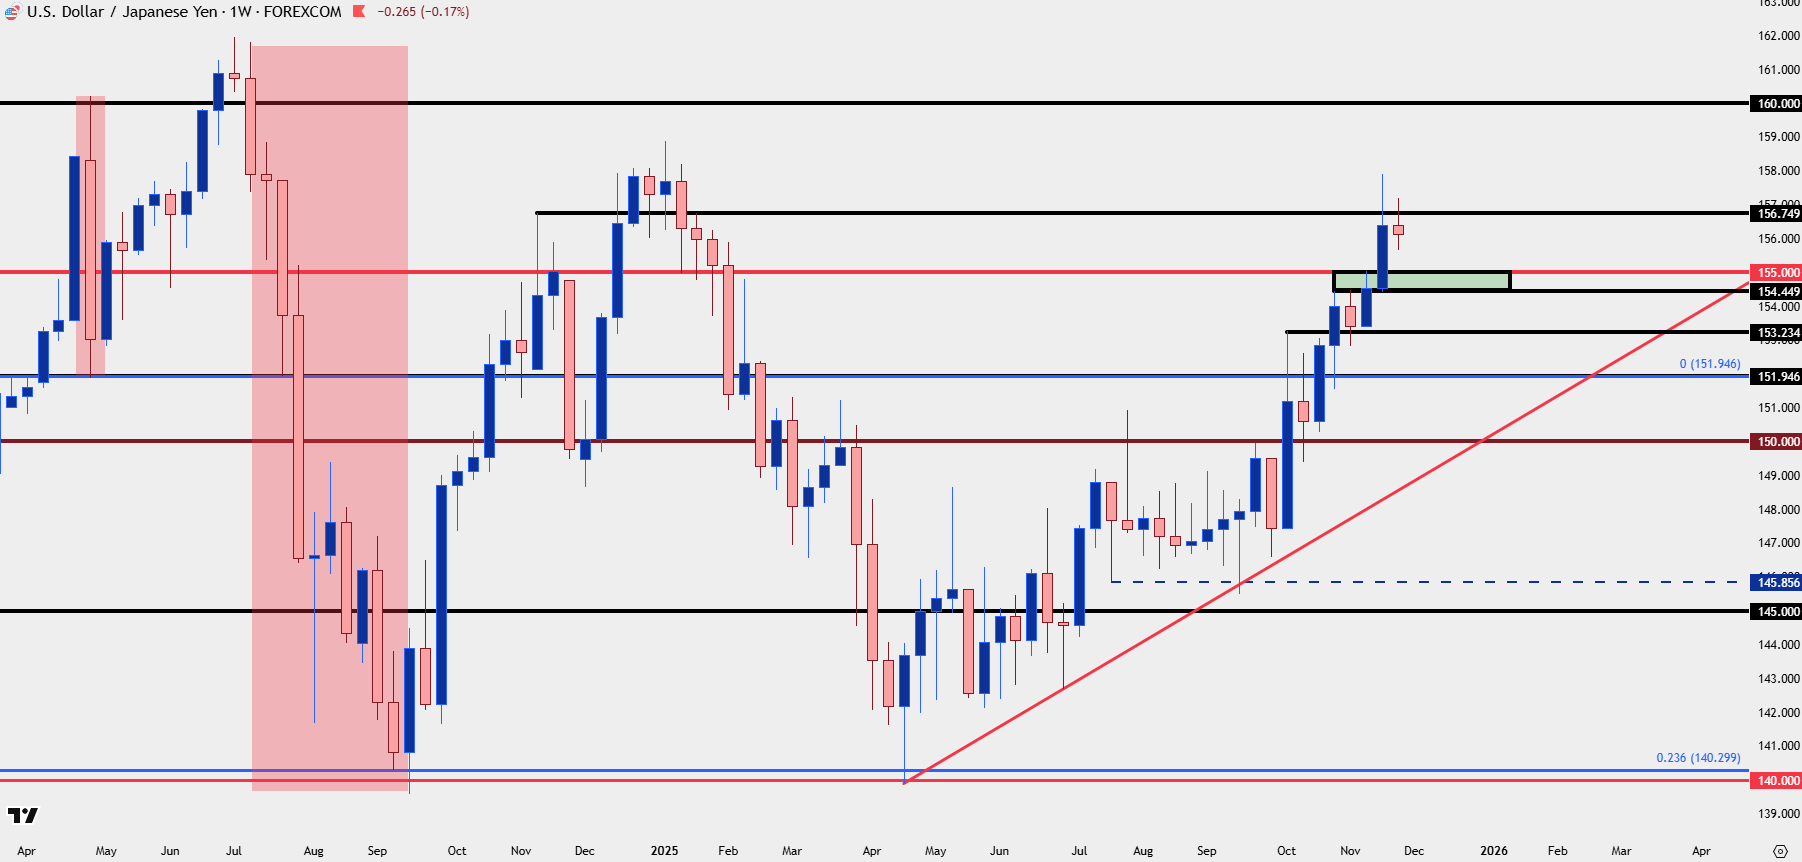
Chart prepared by James Stanley; data derived from Tradingview
USD/JPY Daily
The trend, especially since October, has become increasingly one-sided and this is something that’s already been noted by the Japanese Finance Ministry. That said – last Friday produced a paring back of the rally and I looked at that in the weekend video – but for three days this week, buyers have come in to defend the 156.00 level, which illustrates that the trend may not yet be finished.
What would be an ideal scenario in my opinion would be a slightly deeper pullback next week so that support could be tested in the prior resistance zone running from 154.45-155.00, with the pair retaining bullish structure into the FOMC meeting a week later.
USD/JPY Daily Chart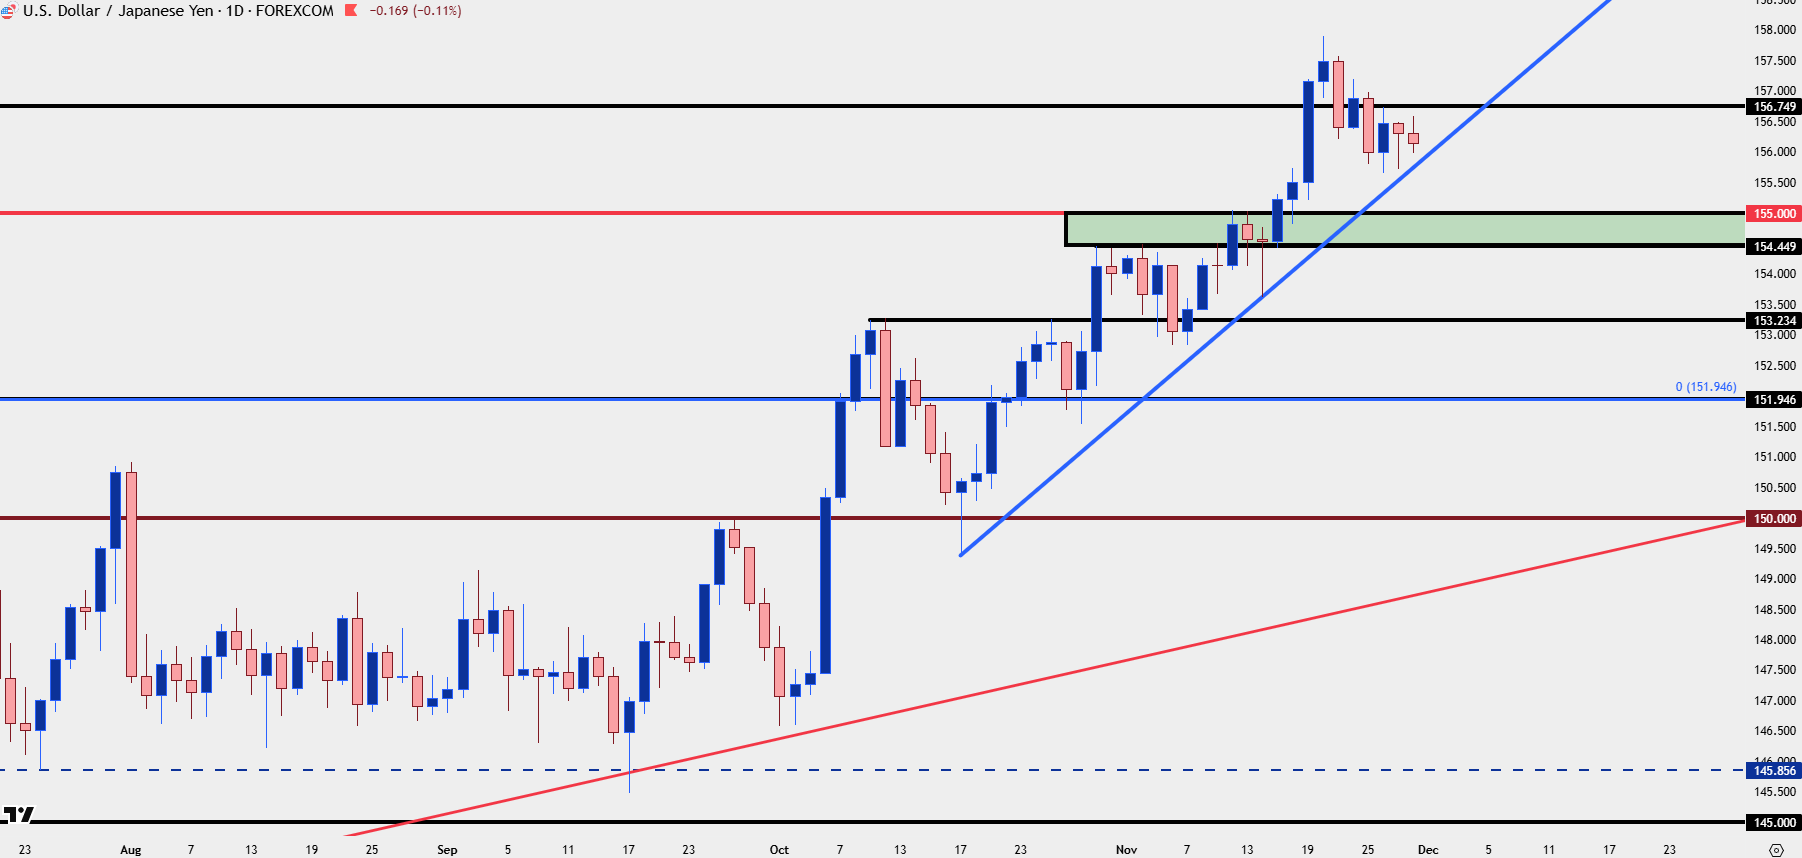
Chart prepared by James Stanley; data derived from Tradingview
--- written by James Stanley, Senior Market Analyst, Global Macro