


It was just a month ago that GBP/USD was in a pitiful state, showing its most oversold RSI reading on the daily chart in more than two years. But paradoxically, that’s when it started look more attractive for those looking to fade USD breakouts. Now the pair is putting in a strong bullish move and testing fresh monthly highs.
If there’s one thing that can prove costly to traders it’s letting their excitement get the best of them, and this often manifests with breakout style strategies as the push to fresh lows or fresh highs seemingly makes the backdrop for continuation seem more attractive.
Nobody likes to lose, nor should you. But trading is one of the few fields in the world where failure, at least some of the time, is practically guaranteed. This often takes some time to learn, however, and on the way along traders will tend to look for strategies that they think might give them an edge; and just in a general sense, as human beings, we often look to be part of a pack due to the perceived safety of numbers.
In many cases a market can often display a lack of trend so that pack behavior may be less obvious – but when a trend does take over, when we do have a ‘new paradigm,’ that basic survival instinct can kick in, and greed can compel us to take action when we otherwise probably wouldn’t. This is the chased breakout, and it happens quite often across markets as a traders fear of missing out can soon get the best of them.
Right now, there are two very stretched moves in markets that have been front-and-center in recent webinars with the US Dollar breaking down as GBP/USD has broken out. And just a month ago both markets were at opposite ends of that extreme, as Cable was at its most oversold in more than two years as USD tested for breakout at a massive level.

I’ve been following GBP/USD as one of the more attractive major pairs for USD-weakness and that potential remains today. The challenge is the fact that both currencies in the pair are stretched and testing major long-term inflection points. In GBP/USD, the pair has run up to a zone of prior support-turned-resistance. The current daily bar has shown is showing as a doji although there’s still time for that to change. But – following the 1.3186 support hold from the Tuesday webinar, there’s a few different spots to look to for pullbacks, such as the prior swing at 1.3287 or the 1.3250 psychological level. If neither of those can hold, I’m looking to that Tuesday low as a point of invalidation for the trend, meaning, even a dip to 1.3200 could remain viable for long strategy provided that bulls disallow from a test below the Tuesday low.
GBP/USD Daily Chart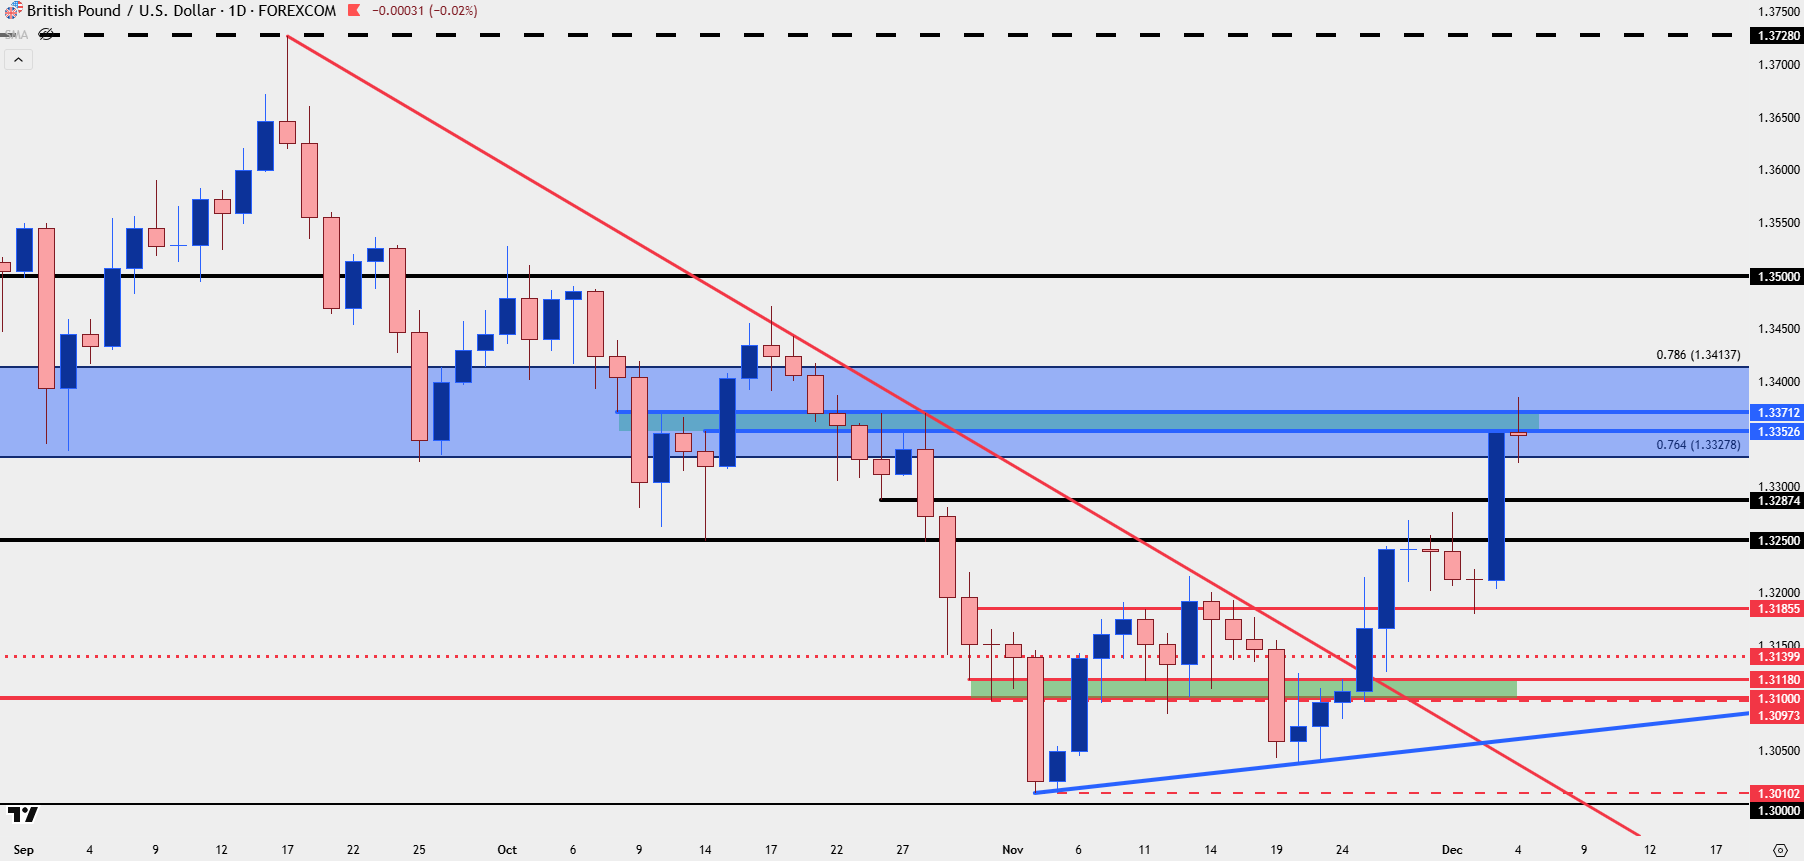
Chart prepared by James Stanley; data derived from Tradingview
--- written by James Stanley, Senior Market Analyst, Global Macro




