
The USD fell quickly to start the week but bulls showed up at a key spot – just above the 98.98 Fibonacci level that held the prior higher-low. That led to a strong bounce yesterday with a large push starting around the US open, and that came along with a pullback in EUR/USD as the pair held yet another lower-high, just inside of the 1.1656 level that marked lower-high resistance in late-November.
The weekly open was a tumble in the USD to go along with a hit to stocks and a sell-off in Bitcoin, but we’ve seen matters recover in each market and there remains widespread expectation that the Fed will cut rates again at their meeting next week. The bigger question, however is what’s in store for next year as there’s still the expectation for another 50 or 75 bps in cuts even though the Fed has been evasive around the topic. Next Wednesday, however, there will be nowhere to hide as the bank is also issuing updated guidance via the dot plot matrix and that will show where the bank expects to guide rates for next year.
This is, of course, with the opacity of lacking data and that’s something that unfortunately will have to wait for 2026 to rectify. But if we do see inflation flare higher that’s going to be problematic, for both equities and other risk markets.

In the USD, the move so far this week has been telling. The currency dipped down towards the 99 level with buyers coming in to hold a higher-low above the swing from a few weeks ago, thereby holding a higher-low. Then underside wick is attractive for bulls but the fact that yesterday couldn’t close in the green thereby disallowing a hammer formation is a factor that must be considered. As I said in the webinar, I expect this to be a difficult backdrop for trends given that the Fed is in the blackout window.
US Dollar Daily Chart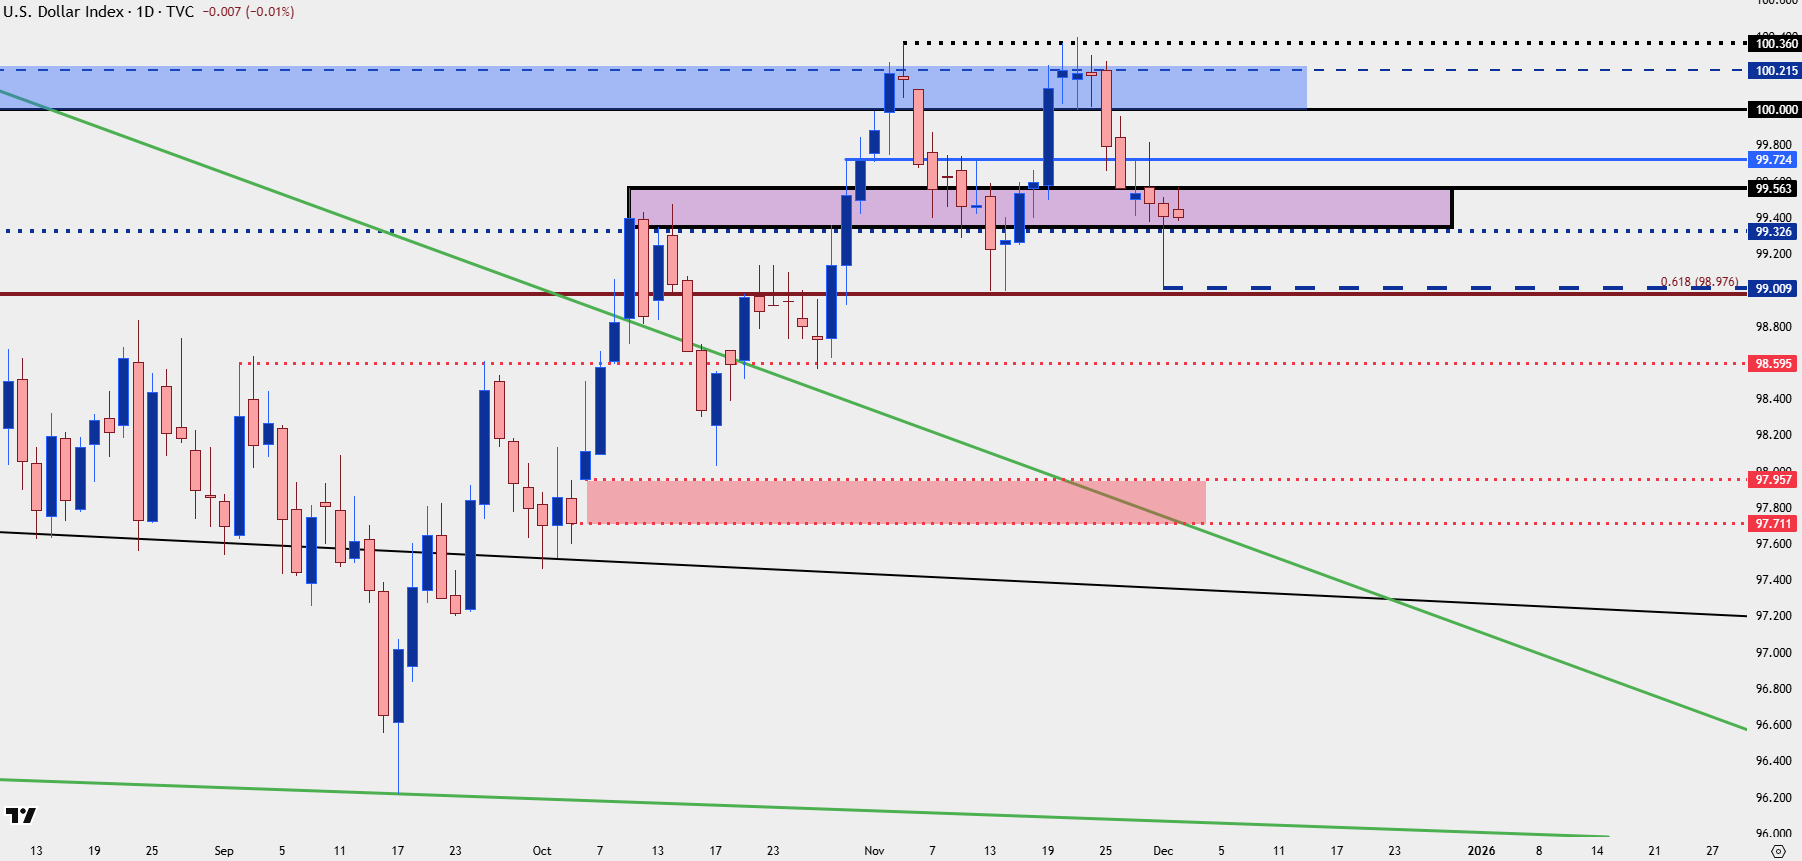
Chart prepared by James Stanley; data derived from Tradingview
EUR/USD
I remain of the mind that the key for USD trends rests with the Euro. And interestingly, as we had USD bulls respond to higher-low support yesterday, we also had EUR/USD bears hold yet another lower-high, with price coming a mere 3.9 pips away from the previous swing high.

On a shorter-term basis, however, there remains a bullish trend and I looked at the familiar 1.1593 level as support in the webinar which has since held. This keeps bulls aligned on the four-hour and two-hour charts and this sets up a possible re-test of resistance around the 1.1650 area.
EUR/USD Four-Hour Chart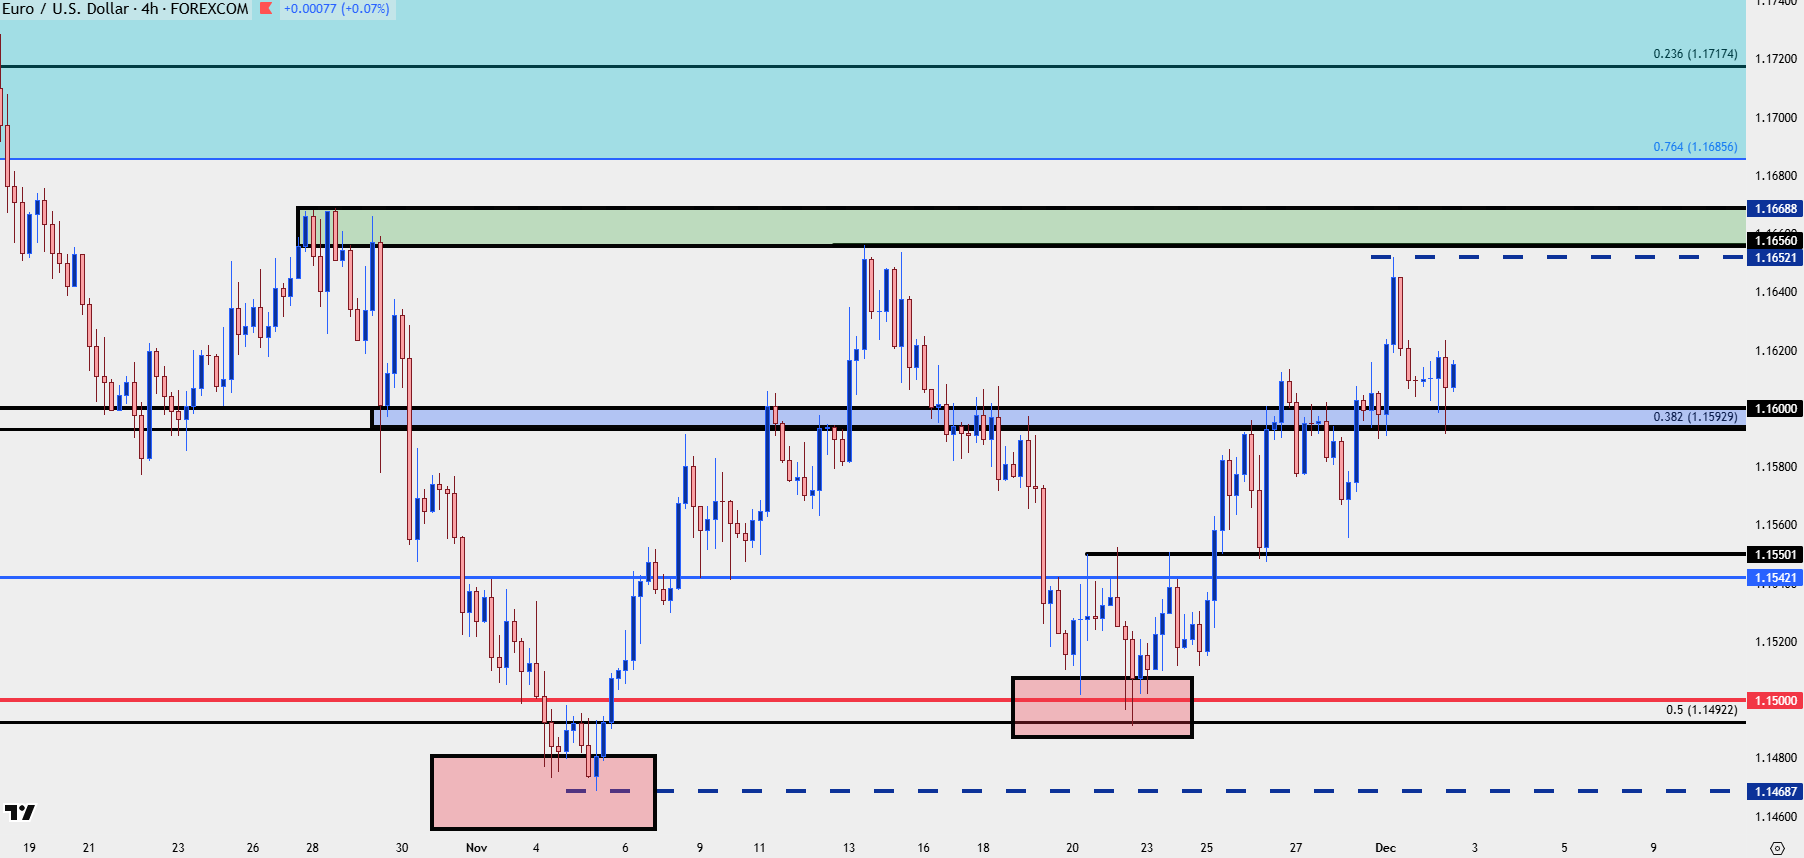
Chart prepared by James Stanley; data derived from Tradingview
GBP/USD
I’ve been tracking GBP/USD as a more attractive venue for USD-weakness than EUR/USD above, and the fact that the pair pushed in a higher-high, even as EUR/USD has remained below the mid-November swing high remains a notable item.
At the time of the webinar, there was also a spot of support in play in GBP/USD and that has since held into a bounce, and that’s taken from a prior level of support-turned-resistance at 1.3186. Overhead, 1.3250 remains initial resistance with 1.3287 followed by 1.3328.
GBP/USD Four-Hour Chart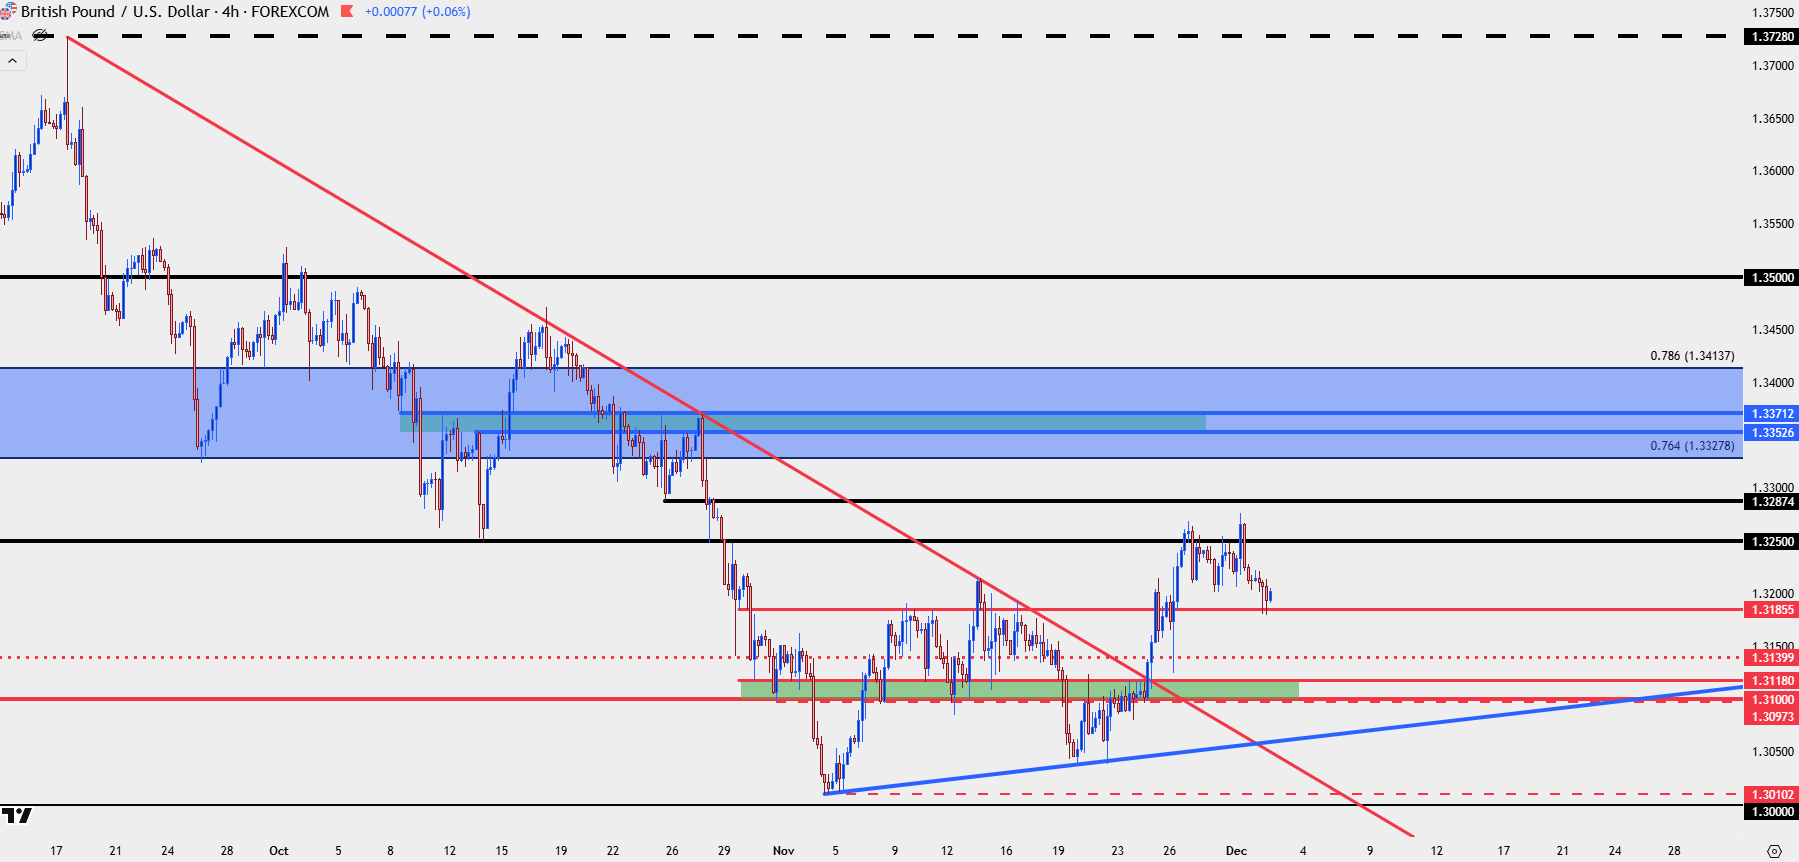
Chart prepared by James Stanley; data derived from Tradingview
USD/JPY
For USD-strength I still think USD/JPY is one of the more attractive major pairs, which, deductively, can be interpreted as interest for both EUR/JPY and GBP/JPY to avoid USD dynamics as we sit about a week away from the Fed.
But last week I looked at support in the 154.45-155.00 area and that so far has held a clean test, with buyers defending the big figure so far. I looked at that zone in the Friday article and, so far, it’s held up.
USD/JPY Daily Chart
Chart prepared by James Stanley; data derived from Tradingview
--- written by James Stanley, Senior Market Analyst, Global Macro