

Japanese Yen Weakness Continues to Drive
Don’t be surprised if grumblings appear from the Japanese Finance Ministry in the coming days. I wouldn’t necessarily expect that to lead to an intervention immediately, as we’re still in the early innings of that theme, but with USD/JPY crossing the 155.00 barrier, it seems we’re due for a veiled threat of intervention.

We’ve already heard an initial comment on the matter, with the MoF saying that “the government is watching for any excessive and disorderly moves with a high sense of urgency.”
Oftentimes the next set of comments is a more tense warning, along the lines of ‘we won’t hesitate to intervene if we have to.” And then, when the Yen weakens some more, usually up to the next major psychological level, we just see a gush of Yen-strength as social media buzzes about a whether or not the Bank of Japan was ordered to intervene.
This isn’t to say that the Ministry of Finance will be able to tilt the trend. When the intervened in April of last year following a test of 160.00 in USD/JPY, the pair merely found support at 151.95 and continued to rally. They ordered intervention again in July following another push above 160.00 but that episode was coupled with falling US inflation and rising odds for US rate cuts. It actually turned out very badly just in a different way, as that intervention spurred a case of carry unwind that soon drove a global de-leveraging event. It took the BoJ months of keeping rates flat to calm markets and by the time we got into Q4 the market reversed on the back of USD-strength.
At this point, however, the next threat of intervention could serve as a pullback opportunity in the trend. Broader fiscal policy in Japan continues to drive towards pro-growth and inflation measures and that’s directly at odds with currency strength, and this is one dominant reason why JPY-weakness has been such a notable theme so far in Q4 trade.
USD/JPY Daily Chart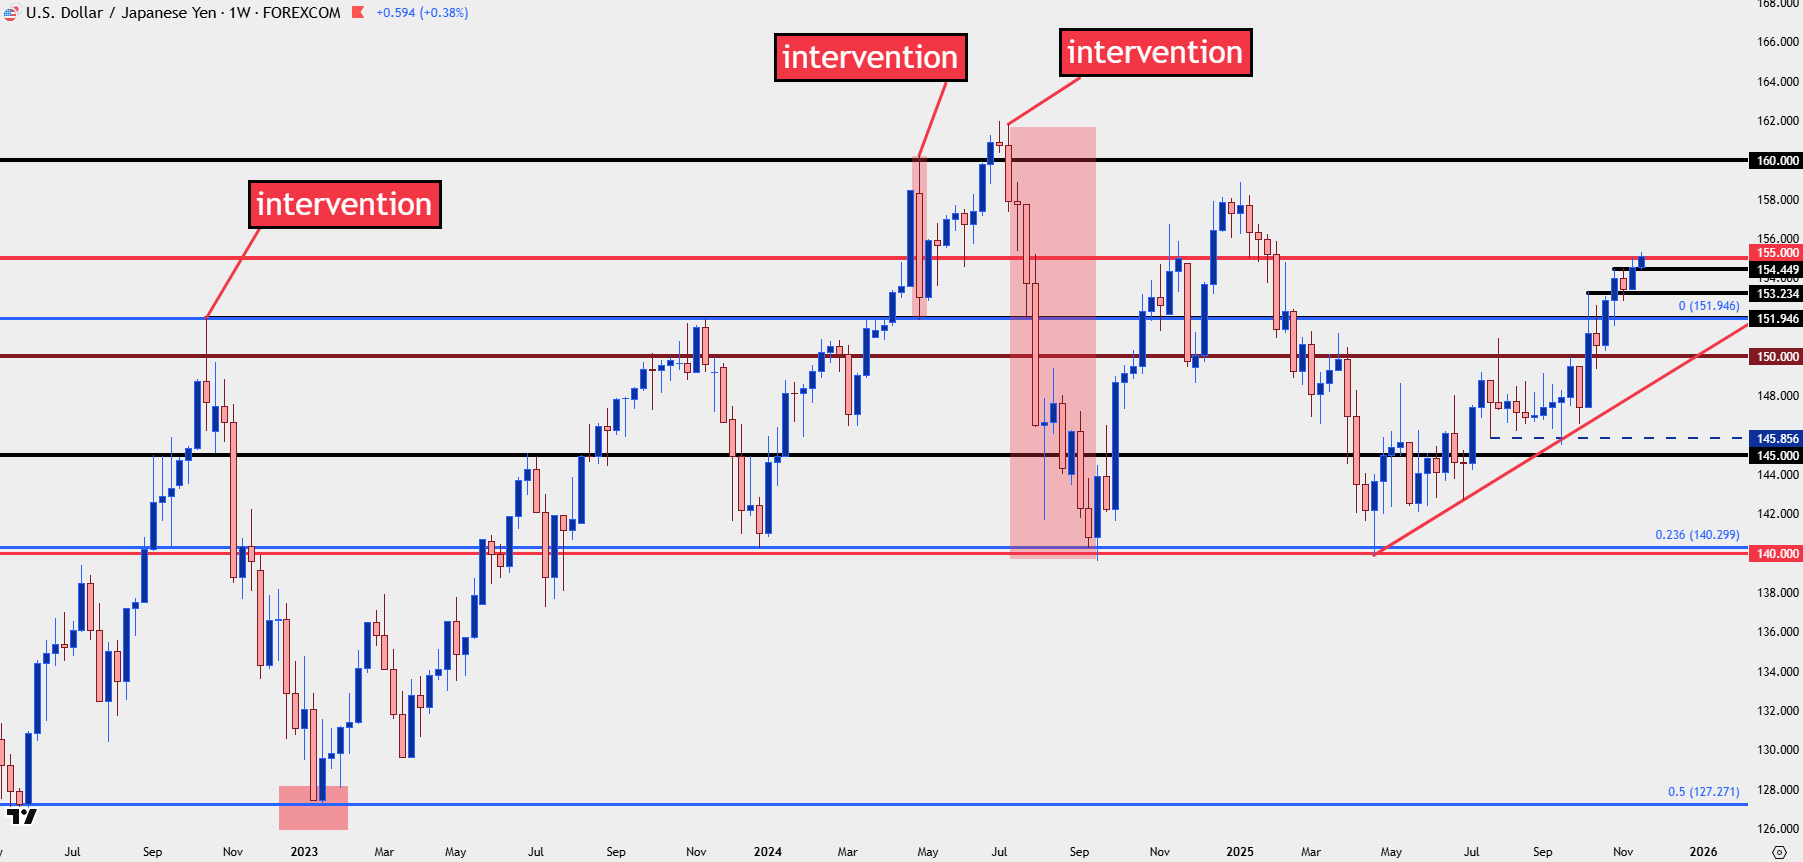
Chart prepared by James Stanley; data derived from Tradingview
USD/JPY
The challenge with USD/JPY at the moment is that the pair is trading above the big figure for the first time since February, and this comes after a clean resistance test there last week. This does allow for continued bullish structure, and if we do get another intervention threat, that could produce a pullback similar to what showed up last week.
The Fibonacci level at 154.33 remains attractive for higher-low support given the multiple iterations of resistance that had showed their previously. And below that, we had a clean bounce from 153.63 last week, and that can be synced down to another spot of prior resistance at 153.28 to create a support zone for deeper pullback scenarios.
USD/JPY Four-Hour Chart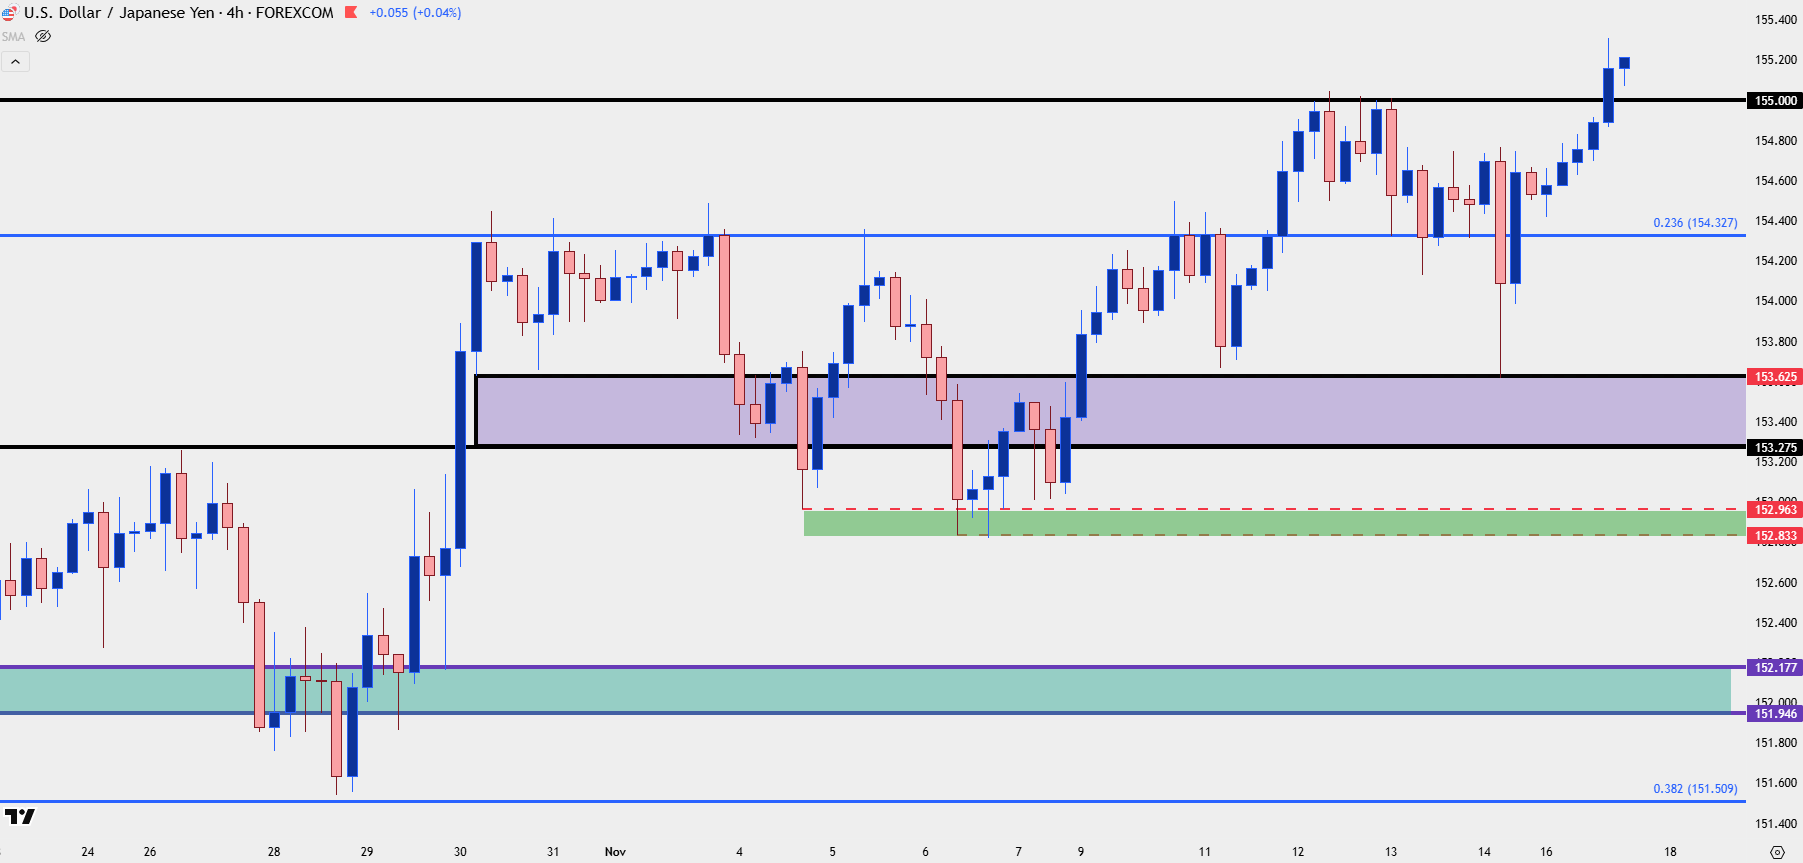
Chart prepared by James Stanley; data derived from Tradingview
EUR/JPY
For much of the past few months I’ve leaned heavier into EUR/JPY for JPY-weakness scenarios, and the pair is now trading at a fresh all-time-high after tagging the 180.00 level for the first time ever. But therein lies the complication as a print above that level could produce profit taking from longs that have been riding the trend.
Nonetheless, the backdrop is still bullish as the horizontal resistance around the big figure matches with higher-lows, so breakout strategies can still be justified. But, for pullbacks in the event that profit taking does appear, there’s a few spots of prior resistance, namely th 178.57-178.83 zone that set the highs in late-October and hasn’t yet been tested for support since the breakout.
EUR/JPY Four-Hour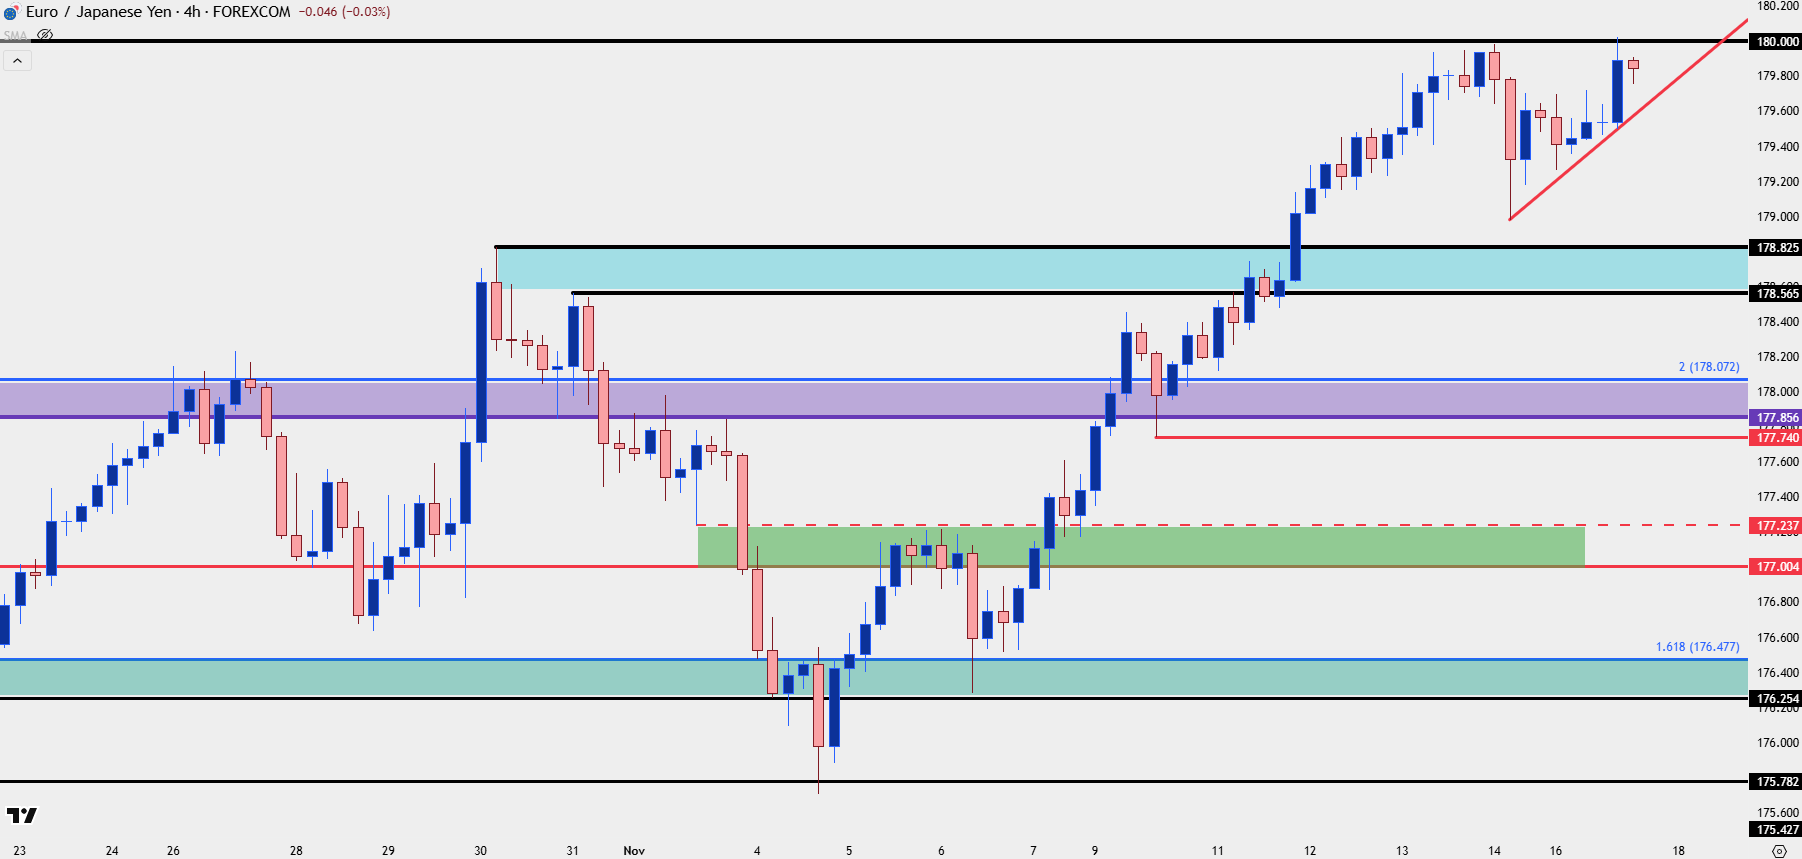
Chart prepared by James Stanley; data derived from Tradingview
GBP/JPY
Last week when I looked into the Yen on Wednesday I shared a breakout setup in GBP/JPY. That has since led to a rally up to fresh monthly highs and I wrote about the pair earlier today as part of a broader British Pound article.
At this point, we’re already seeing a test of support at prior resistance around the 204 level, and there’s a key zone from 203.06-203.31, which was the same area of prior resistance that I looked at last week for the coiling breakout. Overhead, it’s the 205 level that looms large with the 205.33 swing high sitting atop that. If the pair can rally beyond that point, we’re looking at fresh yearly highs in GBP/JPY.
GBP/JPY Four-Hour Chart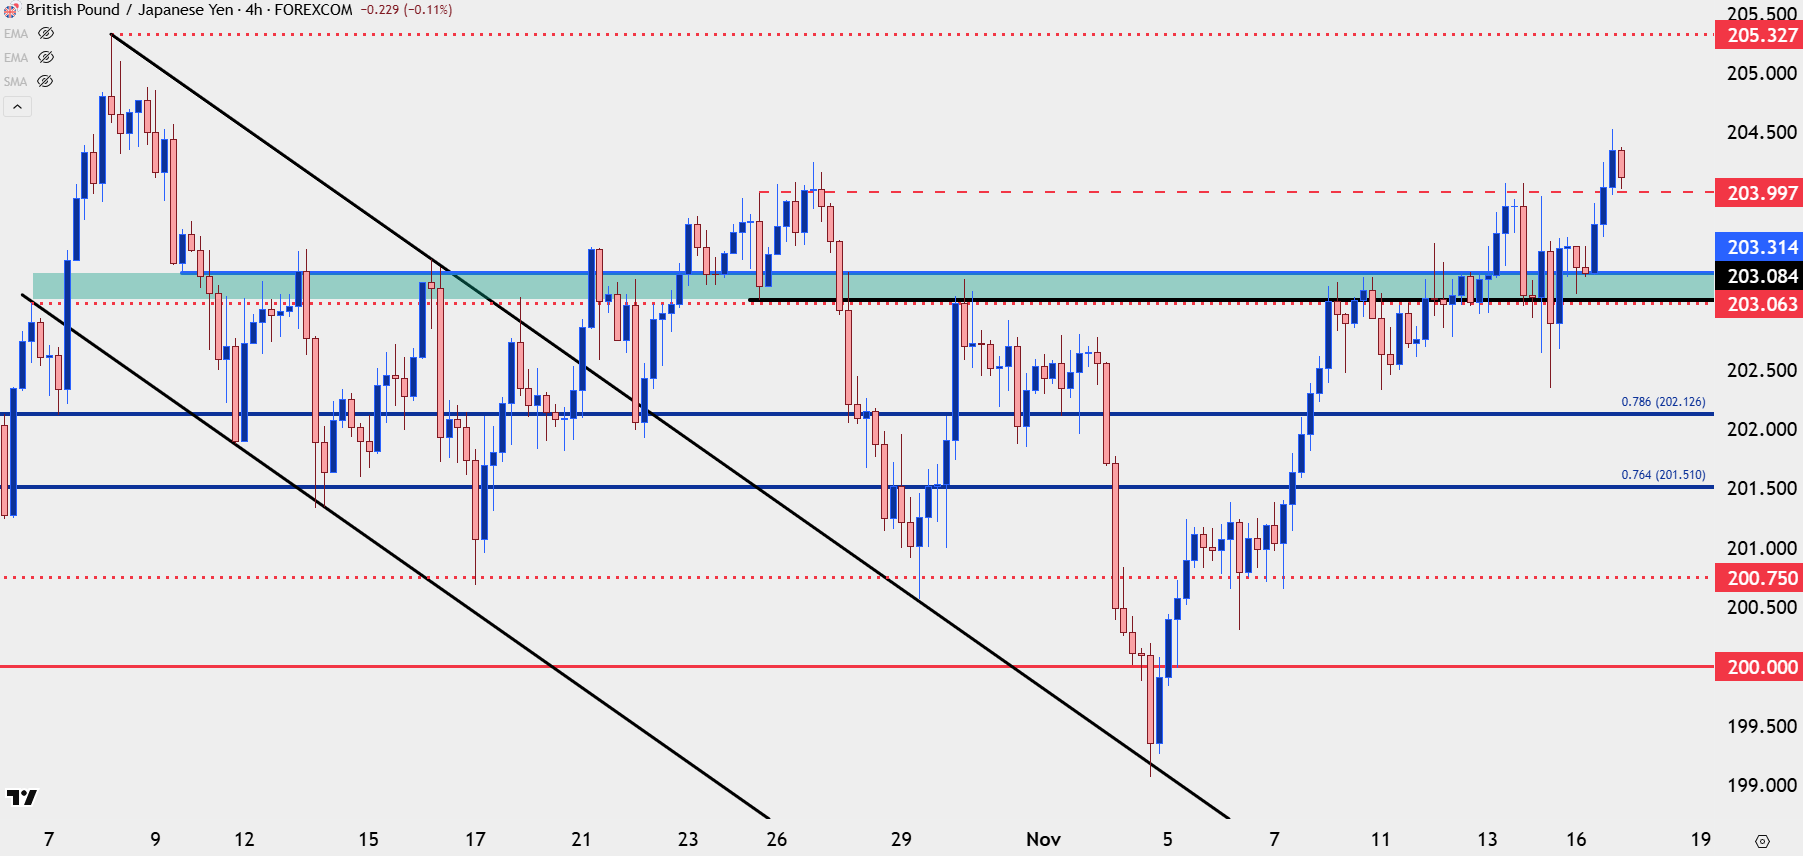
Chart prepared by James Stanley; data derived from Tradingview
--- written by James Stanley, Senior Market Analyst, Global Macro