
Gold was on a strong run coming into this morning, making a fast push up to the 4250 level until sellers showed up to slam the metal back down to support around 4150. That support test is currently ongoing and from shorter-term charts, there’s a setup for bullish continuation that can be justified.

For a few days this week there was the familiar feeling of FOMO in gold markets. The rally that sparked from the bull pennant in August around Jerome Powell’s speech at Jackson Hole ran aggressively, all the way until a double top pattern formed at the 4380 level in mid-October.
That finally brought upon a pullback in the metal but even that was short-lived, with two decisive weeks of selling until last week showed a doji formation. But, notably, the weekly close for the past two weeks both held above the psychological level at $4k, showing that bulls did still show some level of enthusiasm given that they were willing to bid the metal back above the big figure into the weekly close for spot XAU/USD.
This week started off fast with buyers posing a stern bullish break, and from the four-hour chart, there was even a bullish formation that could be argued with an ascending triangle pattern, taken from horizontal support-turned-resistance at $4044 to go along with the higher-lows that printed over the past couple of weeks. That breakout ran strongly, all the way until this morning, that is.
Gold Four-Hour Chart
Chart prepared by James Stanley; data derived from Tradingview
Gold Shorter-Term Structure
As bulls pushed forward in gold on Tuesday, a bullish reversal formation built in the form of a double bottom pattern. The matched lows at 4098 had a neckline at 4145, which pointed to a projected resistance target of 4192. That was broken through yesterday morning and bulls continued to push, all thew ay until 4245 came into the picture earlier this morning and that’s where the music suddenly stopped on the long side.
But – the pullback from that has so far pushed for support at that same prior neckline of 4145, and this represents a possible spot of higher-low support as looked at on the four-hour chart above.
Gold Two-Hour Chart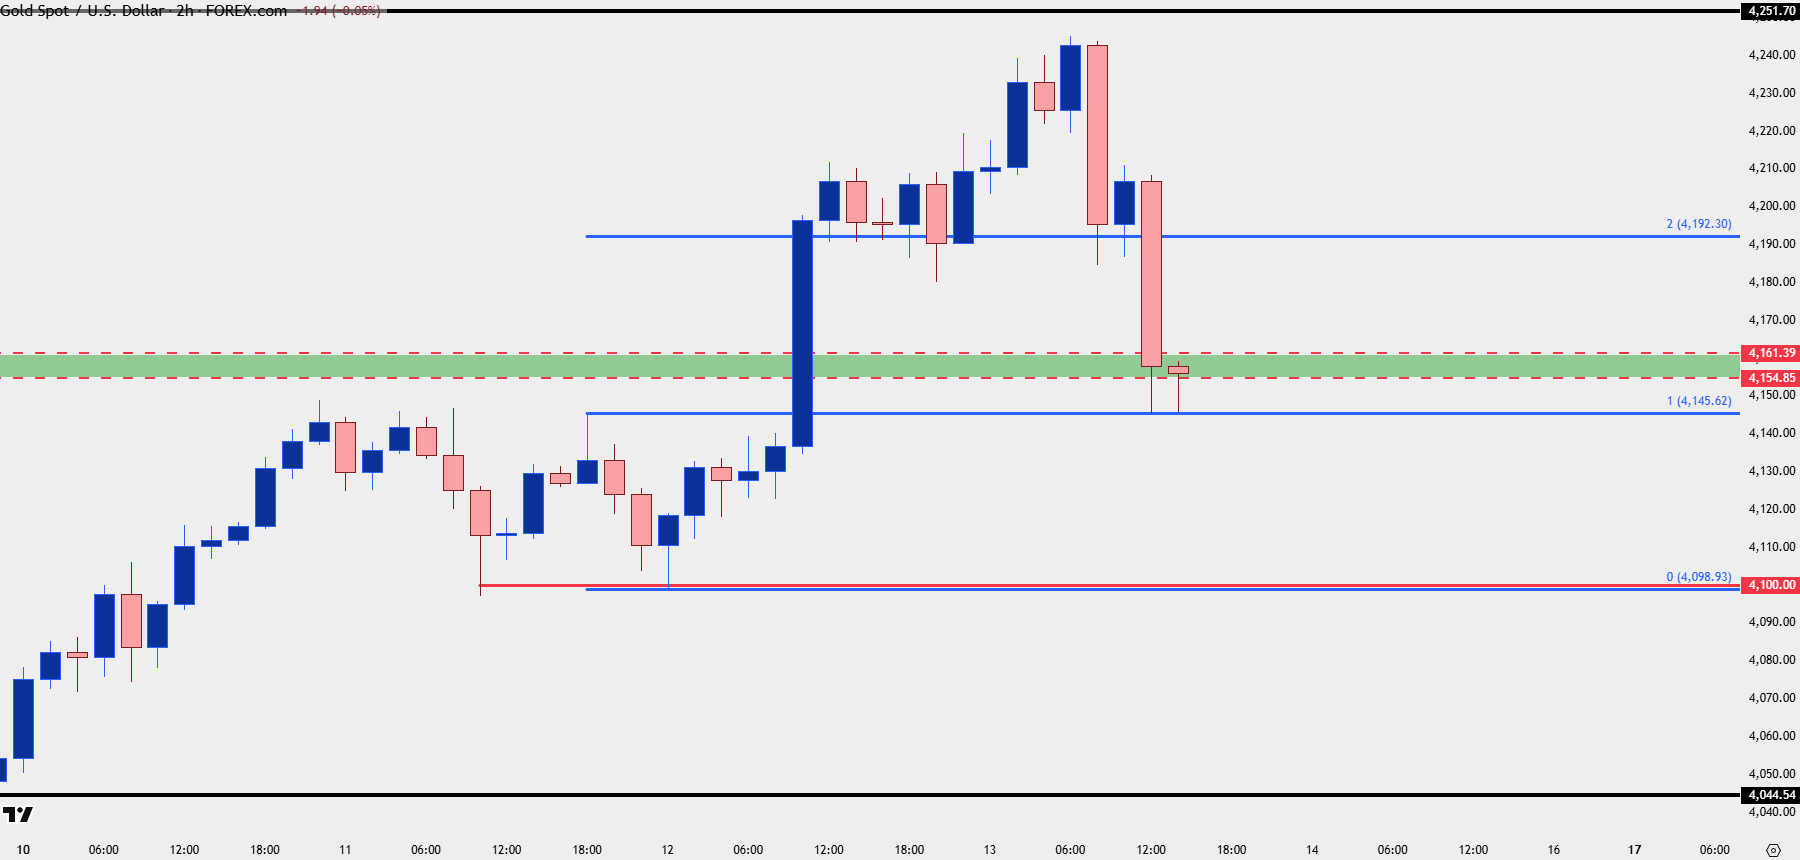
Chart prepared by James Stanley; data derived from Tradingview
Gold Daily
The daily chart isn’t as positive for bulls, although an asterisk must be added as the current daily bar isn’t yet complete, and this can change in the hours until the close for spot XAU/USD. But the upper wick to go along with a red daily candle highlights that rejection from bulls before a test of $4250 could come into play. This doesn’t necessarily erase the bullish trend, but it does put buyers in a more difficult spot as there’s no evidence yet that a near-term low is in, as shown on the two above charts.
If we can see an extension of the bounce from $4145, that statement can change, but, for now, the daily chart puts the focus on deeper supports like the prior double bottom level, which is confluent with $4100, or the prior spot of resistance from the ascending triangle at $4044.
If matters develop quickly, then the $4k level still carries significant importance as buyers abandoning support at that price would indicate a larger shift in the bigger picture backdrop around gold.
Gold Daily
Chart prepared by James Stanley; data derived from Tradingview
Gold Weekly
Getting back to the big picture and this explains why the finish into the week is so important.
An indecision candle like last week’s doji showing after two weeks of counter-trend behavior illustrates well a possible change-of-pace. The fact that this was followed by a strong rally to start this week futher illustrates that. I’ll often look at this formation as a morning star, although in full disclosure, many technicians only entertain such patterns after a prolonged downtrend or sell-off. In my opinion, however, it’s what the formation is saying that’s more power than what was happening before it even came into play, and in the case of what we have now, a strong finish to this week would further suggest that the pullback that started last month has met its maker, and that bulls are back in the driver’s seat to extend the big picture rally that has been going in one way or another for the past 21 months.
So, to summarize, bulls looking to press long exposure would likely want to harness the shorter-term vantage point as an extension of this week’s rally could further fill in the upper wick that’s now showing on the non-completed weekly bar. If that comes to pass, the long-term backdrop on gold would be more bullish, and that would carry potential into next week.
If, however, that short-term support does not hold, the prospect of a deeper pullback or retracement has to be entertained, and along with it would be the possibility of great digestion or consolidation of the longer-term trend. After all, for the two bull pennants that have formed since gold’s rally from $2k last February, one was two months and the other took four months. Right now we have a simple few weeks of pullback so it would still be too early to say that the profit taking from longer-term buyers is finished.
Nonetheless, the chart often leads the way and the narrative usually follows, and that’s what I’m tracking here with this multiple time frame outlook in gold.
Gold Weekly Chart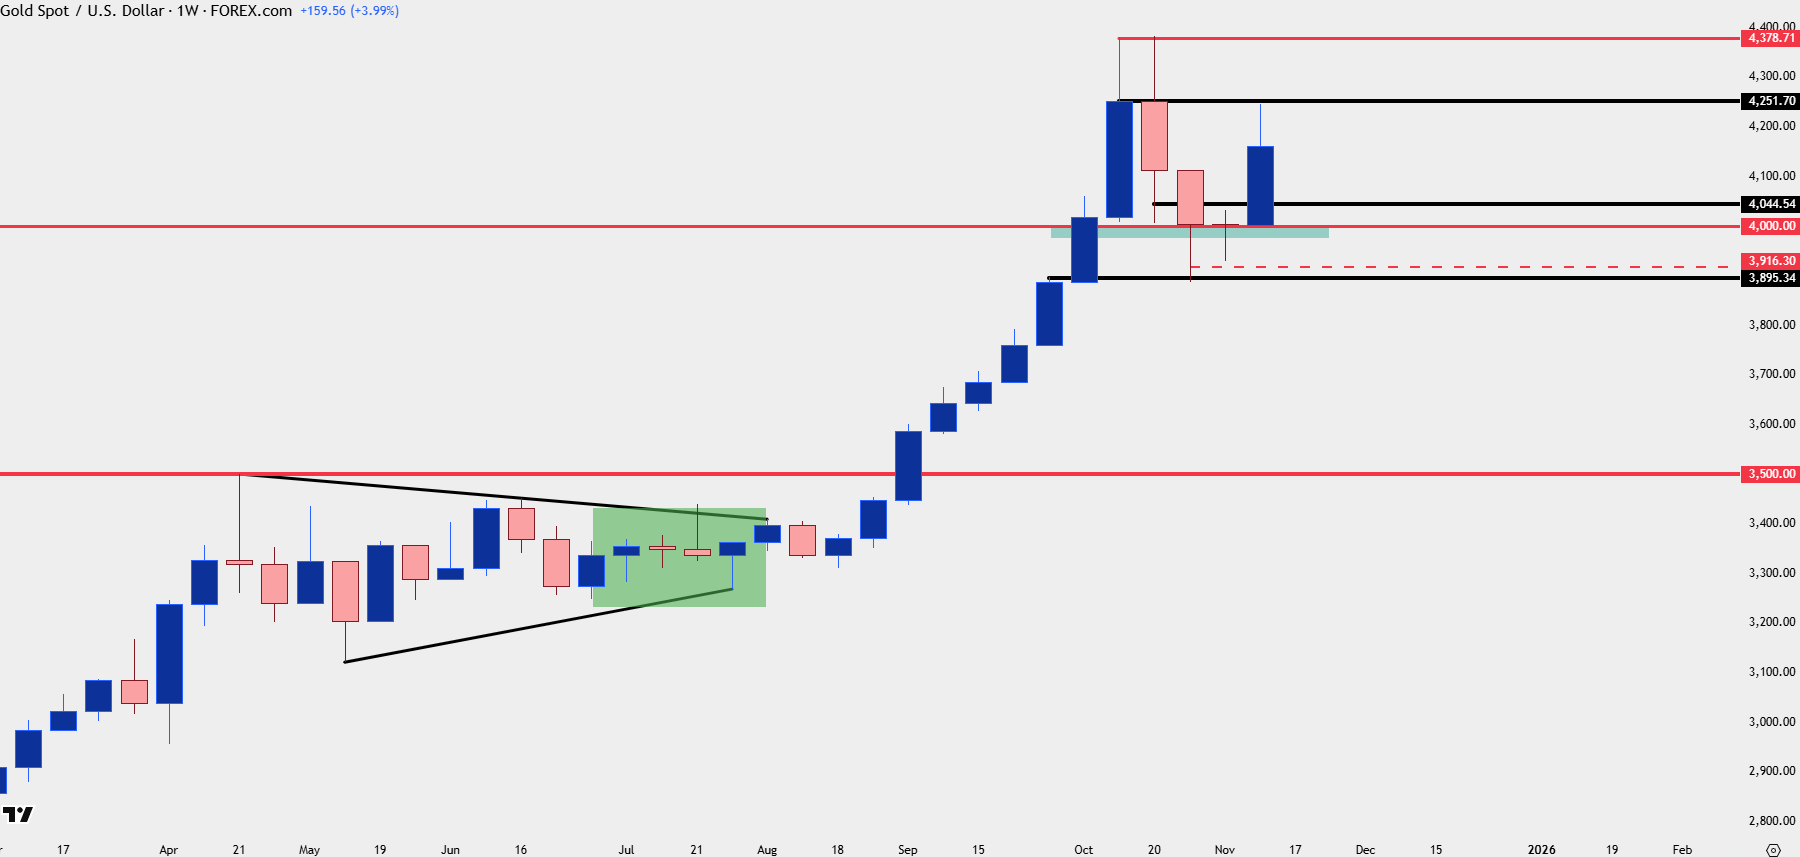
Chart prepared by James Stanley; data derived from Tradingview
--- written by James Stanley, Senior Market Analyst, Global Macro