
The Japanese Yen rallied last week after a massive breakdown the week before. USD/JPY, EUR/JPY and GBP/JPY all remain in bullish sequences, but the big question for this week is whether buyers can press the move into continuation.

USD/JPY
In USD/JPY, the 150.00 level has so far remained defended and given context from the weekly, I think this still retains a bullish bias, at least until the zone running down to 148.00 is taken out.
The Fibonacci level at 147.94 seems particularly important here, as it’s confluent with the 200-day moving average and this is the 23.6% retracement of the 2021-2024 major move. This helped to set resistance during the two months of range, and since the recent breakout, hasn’t yet been tested for support. So, a quick spate of short-term Yen strength could bring that zone into play.
USD/JPY Weekly Price Chart
Chart prepared by James Stanley; data derived from Tradingview
USD/JPY Shorter-Term
On a shorter-term basis, the 150.00 level remains key in USD/JPY. This was the spot looked at in last week’s webinar and, so far, bulls have defended that as an important line in the sand. So far this week, we’ve seen a higher-low on a short-term basis so that could be an early sequencing into strength, although I think Yen-weakness could perhaps be more attractive elsewhere at the moment.
USD/JPY Four-Hour Chart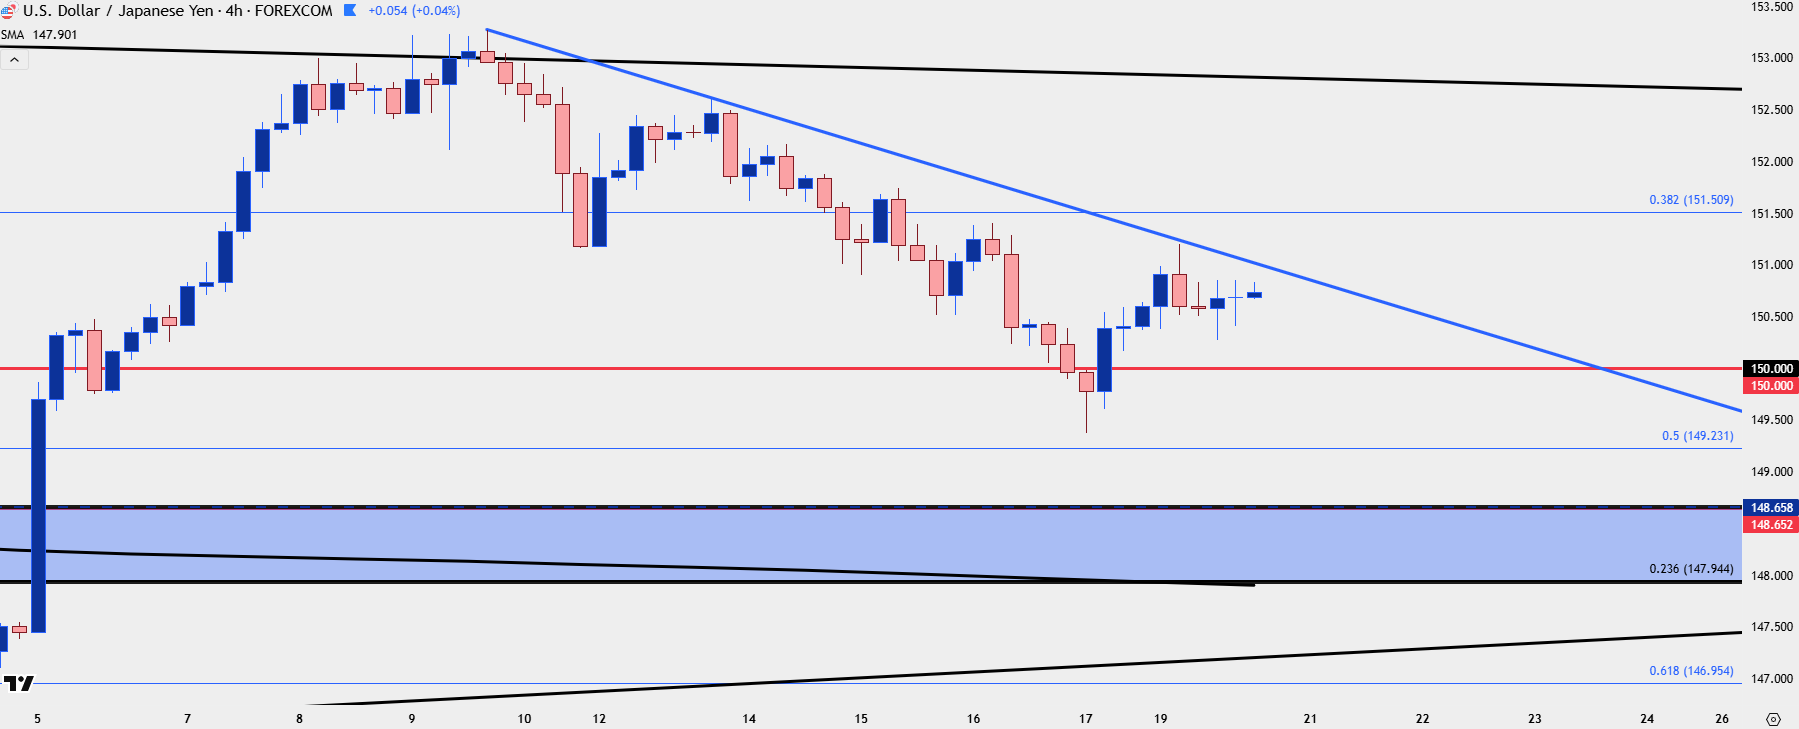
Chart prepared by James Stanley; data derived from Tradingview
EUR/JPY
There’s a similar dynamic in EUR/JPY and the big level here is the 175.00 handle that came into play briefly on Friday. But, so far this week, we have a similar higher-low holding at 175.43, which was the swing high last year that showed just before the massive reversal in July.
EUR/JPY Four-Hour Chart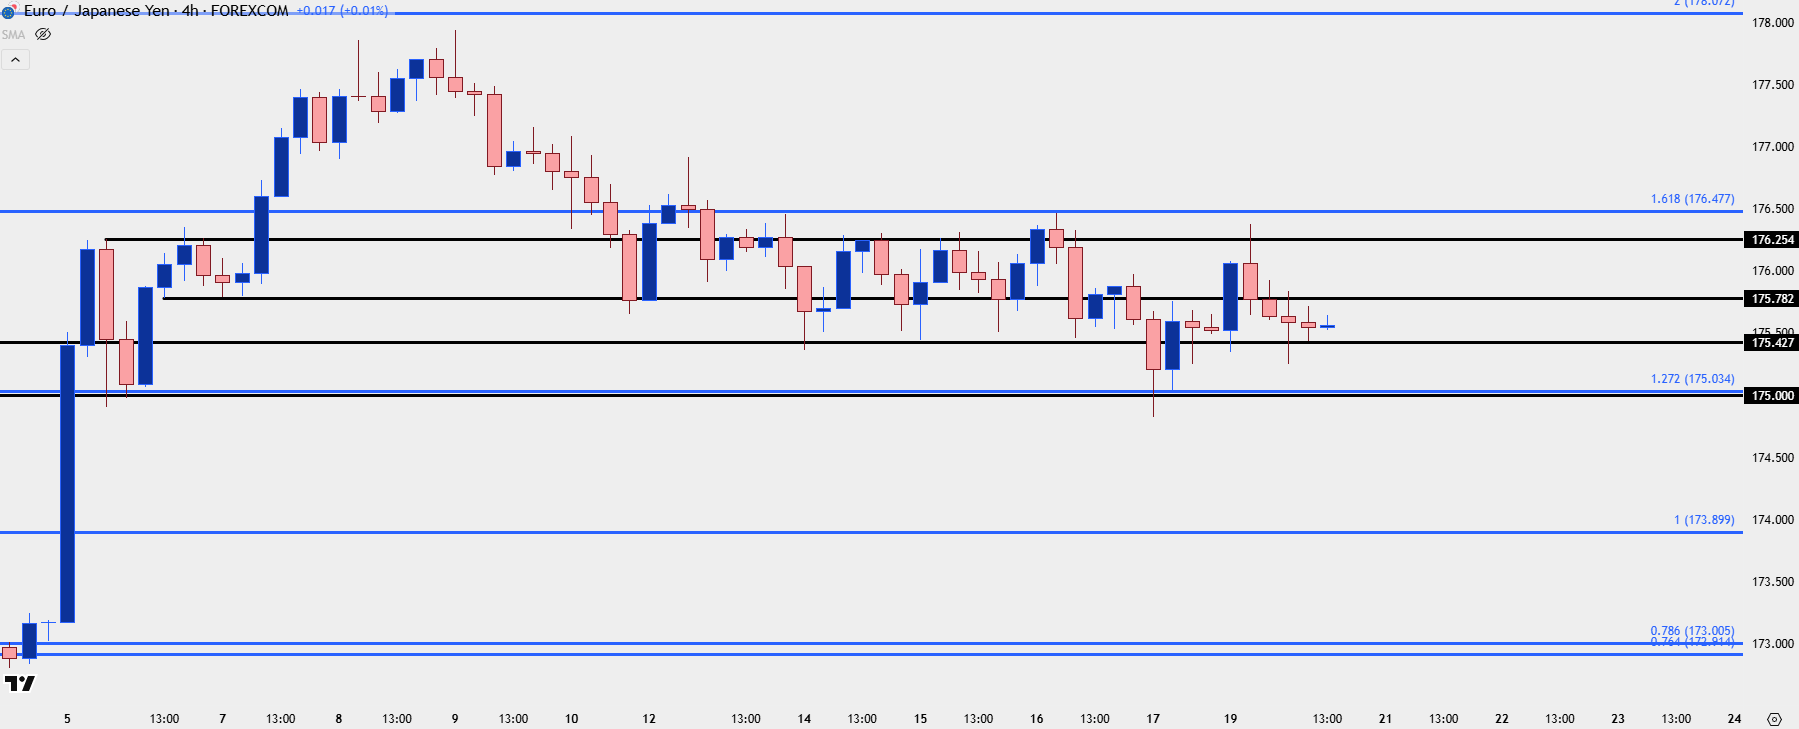
Chart prepared by James Stanley; data derived from Tradingview
GBP/JPY
As I looked at in the webinar last week and then again in the weekend video, GBP has had preference for strength over the Euro, and that statement can span across Yen-pairs, as well. In GBP/JPY, last week’s low printed at a prior point of resistance of 200.75. And the bounce from that has already pushed up for a test of trendline resistance in a short-term bull flag setup.
But I think what’s most attractive here is what didn’t happen. While USD/JPY pushed down to 150.00 and EUR/JPY to 175.00, GBP/JPY didn’t fall all the way down to the psychologically important 200 level as bull showed up a bit earlier.
GBP/JPY Daily Price Chart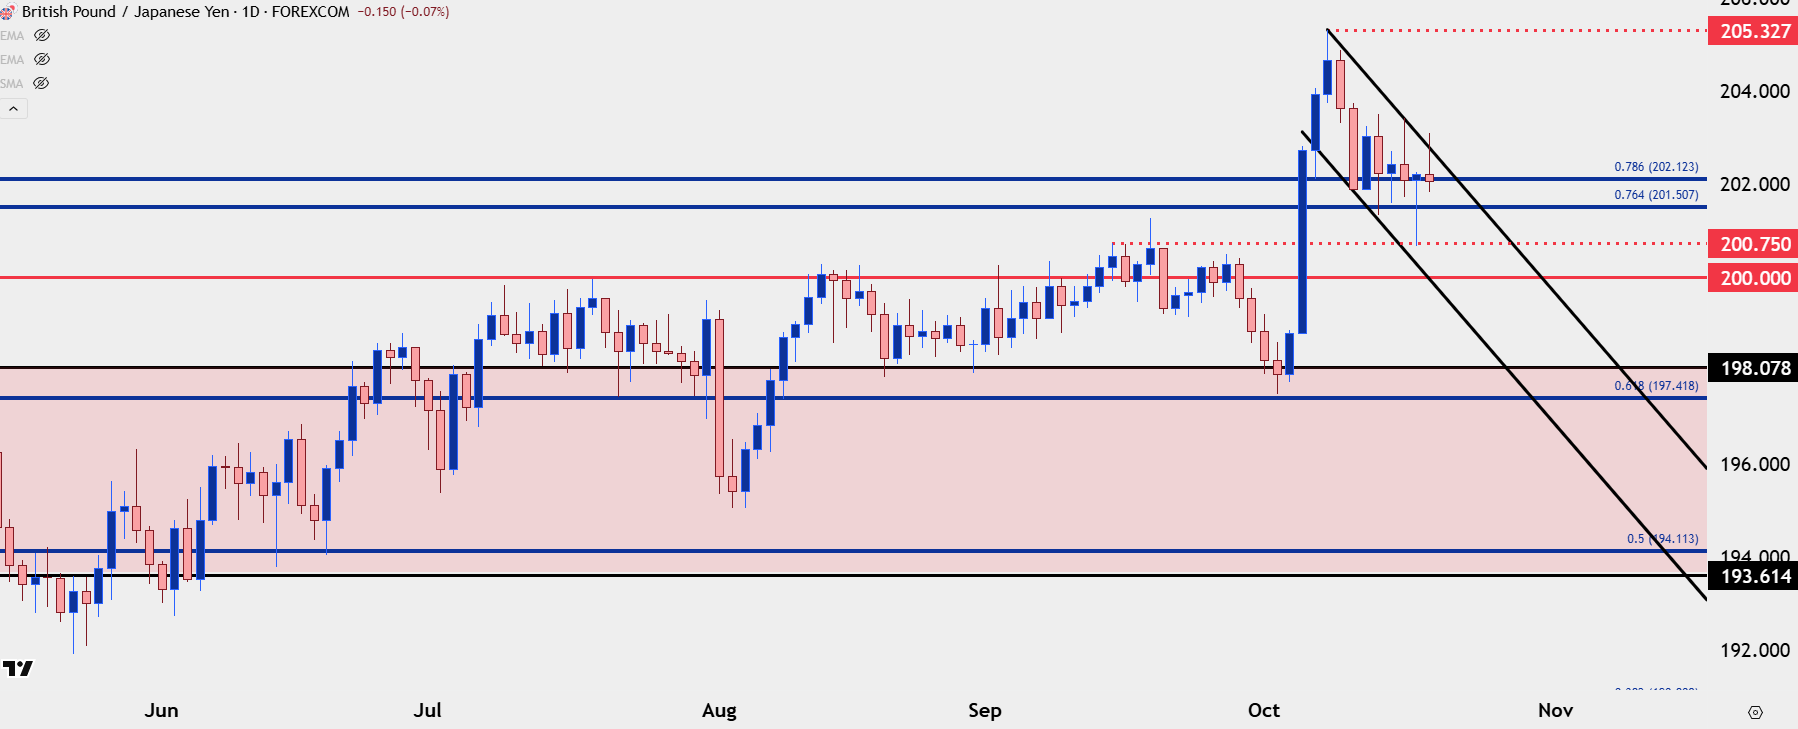
Chart prepared by James Stanley; data derived from Tradingview
GBP/JPY
At this point it’s the 78.6% retracement of last year’s sell-off that’s being tested for support, and the 76.4% retracement of that setup also remains of interest, plotted at 201.51. A response to either would allow for higher-low support, and it’s a breach of the 203.00 level that would mark a break of the bull flag and an opening door for bullish resumption of the broader trend in GBP/JPY.
GBP/JPY Four-Hour Chart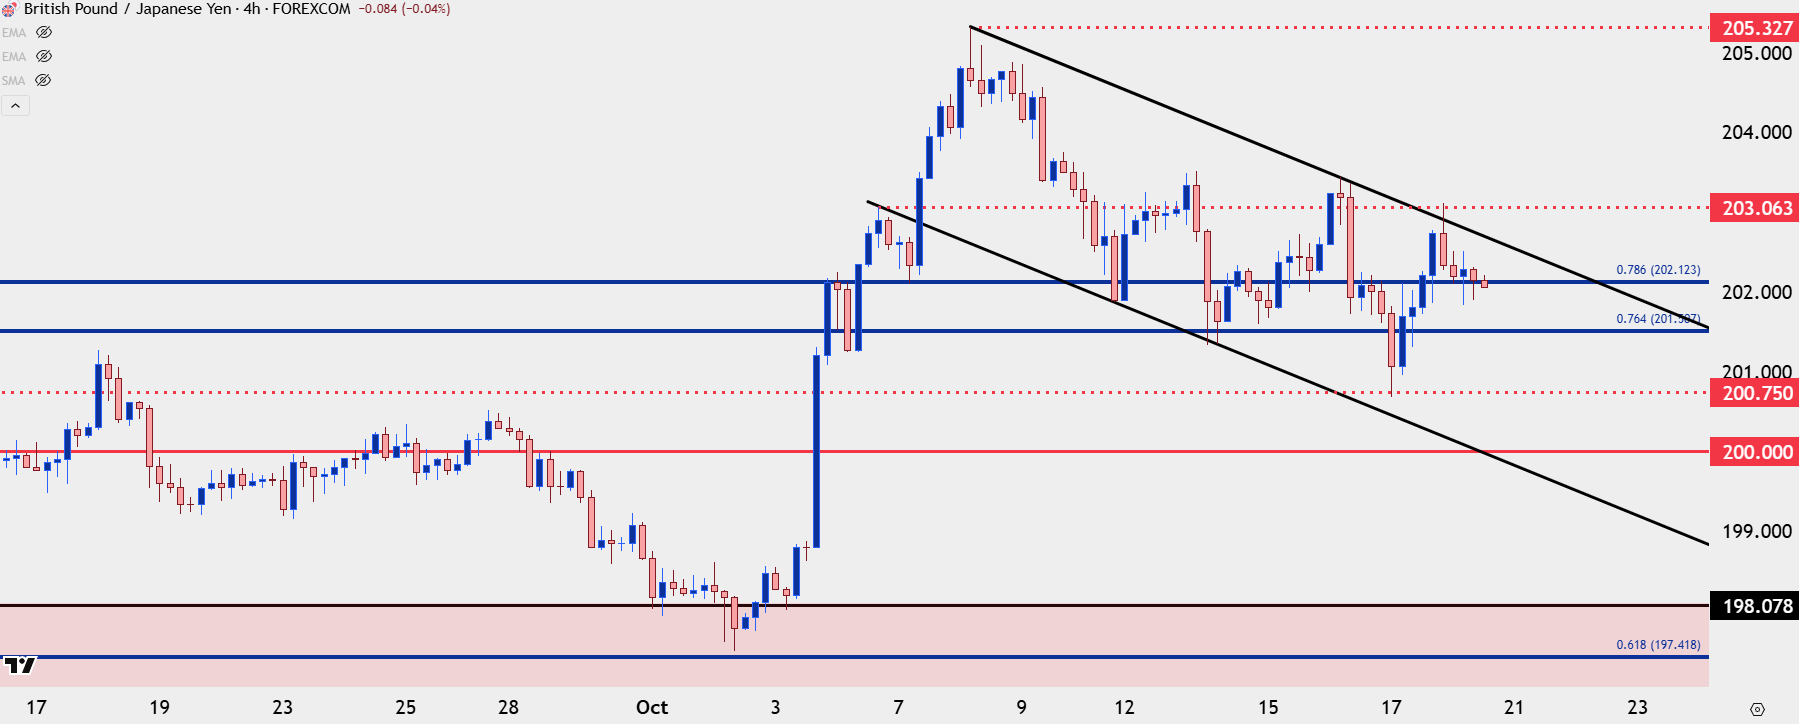
Chart prepared by James Stanley; data derived from Tradingview
--- written by James Stanley, Senior Strategist