
The GBP/USD fell below the 1.33 handle today as the dollar gained further ground against most major currencies. The GBP has remained supported against other currencies, thanks to a hawkish BoE and high UK interest rates. From the USD side, a hotter-than-expected CPI report has strengthened the case for further Fed rate hikes. This has dimmed an otherwise relatively bullish GBP/USD forecast. But with the dollar being the strongest currency out there, even the GBP/USD now faces downside risks. However, if you are bullish the pound then the GBP/AUD might be the one to watch for further upside potential. The Australian dollar remains exposed after the RBA paired its rate hike with a strong signal that a long pause lies ahead.
Coming up: UK GDP and US PPI
On Thursday, November 12 at 07:00 GMT we will have both the monthly and quarterly GDP estimates, along with a few other UK macro indicators. Sterling has been among the stronger performers in G10 space, until its most recent weakness. With the inflation outlook continuing to support the hawkish BoE narrative, this should see the pound outperform against other weaker crosses - especially if GDP also overshoots. Perhaps not so much against the US dollar, given how strong the latter has become this week.
In the US, consumer inflation surprised to the upside and we have heard hawkish Fed comments since. With inflation remaining sticky, any overshoot PPI, due on Friday 13 November, should further boost expectations of a December hike, keeping the dollar supported.
Pound forecast: GBP/AUD is the pair to watch for Sterling bulls
Should the upcoming UK macro data surprise to the upside, then the GBP/AUD is arguably the best pair to trade on the long side given RBA’s dovish signal last week.
The Australian dollar faces a different set of challenges: from domestic issues such as falling wages and weakening economy and high inflation, to external factors such as weakness in Chinese demand, Australia’s largest trading partner.
Last week, the Reserve Bank of Australia raised interest rates but accompanied that decision with a strong signal that a prolonged pause could follow. That has taken some support away from the Aussie and helped the pound-Aussie break higher, moving decisively away from the psychologically important 1.9000 level.
Meanwhile, hotter UK inflation and a hawkish Bank of England have kept the pound supported on the dips. Consequently, GBP/AUD has been able to push higher, and further upside could be in store, particularly if risk sentiment deteriorates or Australian data starts to disappoint.
GBP/AUD technical analysis
From a purely technical perspective, the cross has broken above both its 200-day moving average and its 21-day exponential moving average, suggesting that the trend has turned bullish. More importantly, it has cleared a key resistance zone between 1.9350 and 1.9400. This area had capped gains on several occasions, initially in February and March, and then repeatedly between June and July.
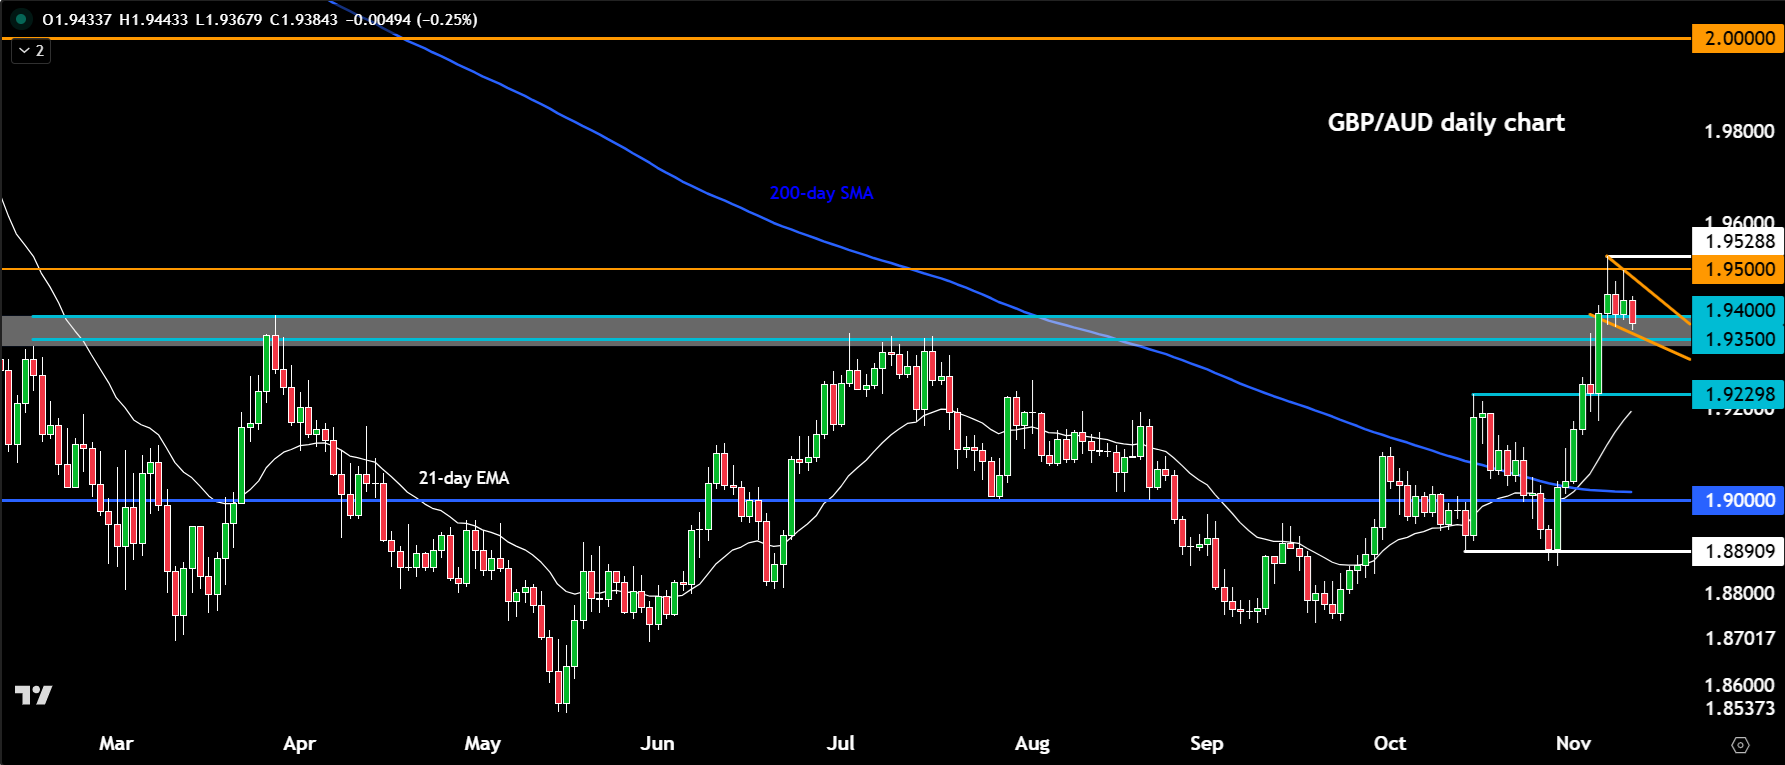
We tested that zone again last Wednesday, initially seeing another rejection. However, the following day brought a decisive breakout above it, strengthening the bullish technical picture.
Ahead of Thursday’s UK data, GBP/AUD has been consolidating its recent gains. The price action is beginning to resemble a bullish flag, or potentially a falling wedge. If the UK figures surprise to the upside, or the pair simply finds support around current levels, we could see another leg higher, with a break above the psychologically important 1.9500 level potentially signalling further upside.
Beyond 1.9500, there is relatively little in the way of obvious resistance until the next round-number levels at 1.9600 and 1.9700. The major psychological 2.0000 level would then come into focus as the next significant upside target.
Dollar goes from strength to strength
Meanwhile, the US dollar has staged a sharp recovery yesterday, helped by hawkish remarks from Fed Governor Christopher Waller, who suggested further tightening could be necessary and signalled openness to a larger 50bp move. Before the US CPI release, the risks for the dollar looked fairly balanced into the end of the week. The October CPI report has since come in hotter than expected, with headline prices up 0.4% month on month against forecasts of 0.3% and core CPI up 0.3% versus 0.2%. That strengthens the case for further Fed rate hikes, and an upside surprise of this kind has quickly revived rate-driven support for the greenback.
Technical GBP/USD forecast
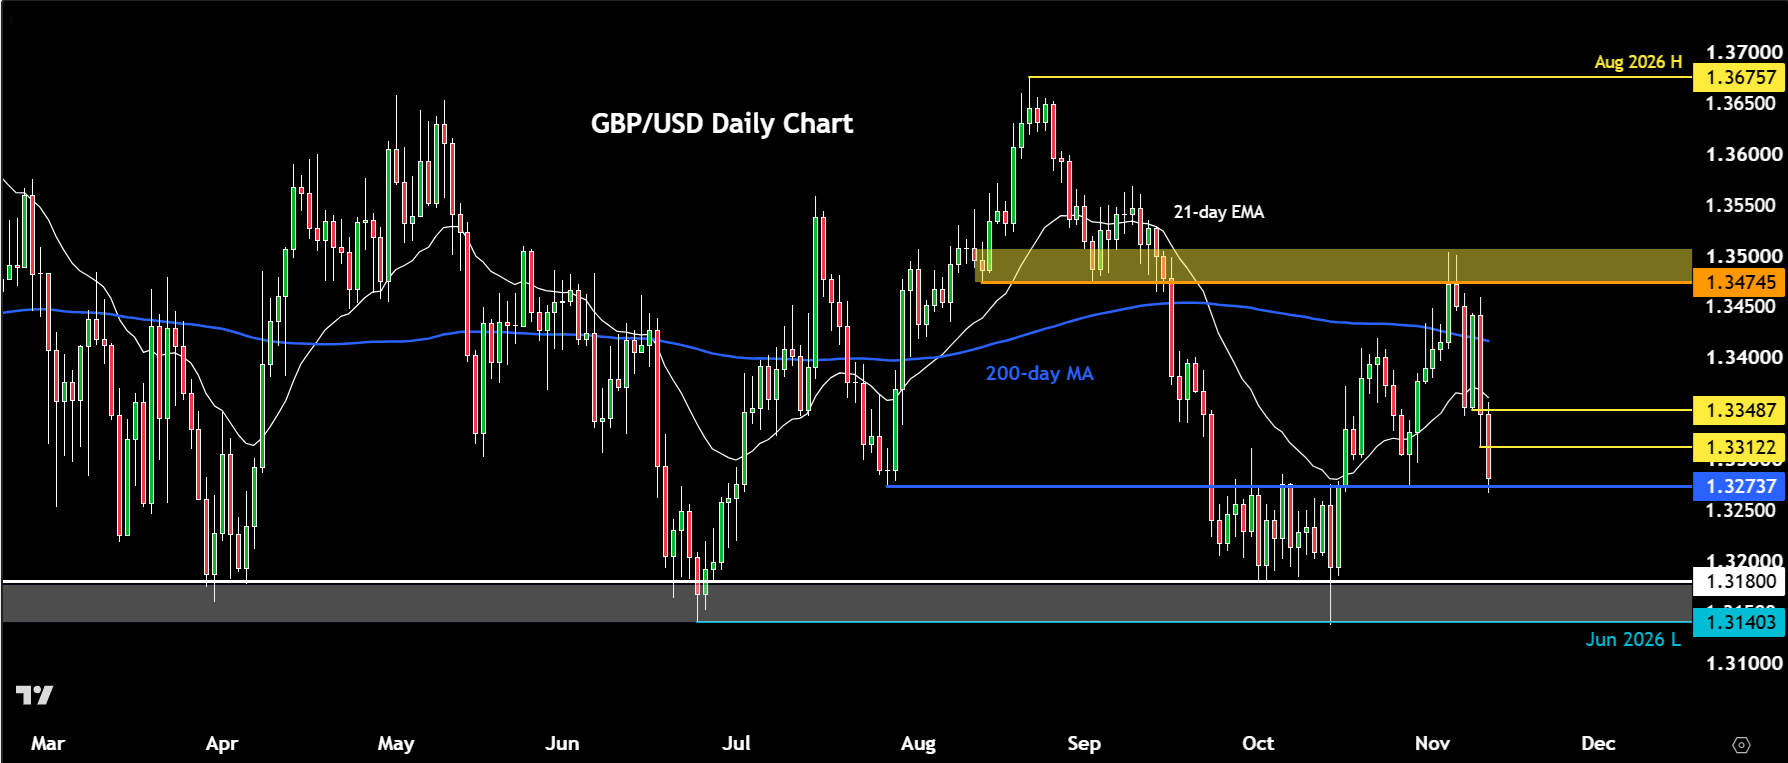
From a technical analysis point of view, the GBPUSD chart has recently broken below its the 200-day moving average and the 21-day exponential, suggesting objectively that both the near term and long term trends have turned negative. However, it is important to note that the pair has been trading range0bound for much of the year. So, the breakdown below these averages should be taken with a pinch of salt. That said, the dollar is breaking higher against most currencies out there and so I wouldn’t necessarily fight it. The short-term path of least resistance remains tilted to the downside for GBP/USD unless we see a big reversal pattern soon.
Key support levels to watch on GBP/USD
- 1.3270 – this level was formerly support. Price broke below it in the latter half of September, but didn’t hold there for long, before storming back above it. However, since then the rally has lost steam and now we are back at the same level. Break it an we could be heading down to…
- 1.3140-1.380 range – this support area was where the GBP/USD found solid support back in April, June and October. The triple bottom is usually a strong sign. But upside follow-through is lacking. Thus, a breakdown could be on the cards if the dollar rally extends.
Key resistance levels to watch on GBP/USD
- 1.3312 – marks the low from Tuesday when the pair created a bearish engulfing candle. Break above it on a closing basis would be a first positive sign.
- 1.3350ish was support and the low from Monday that was later taken out. Above it would be a further positive sign if we go there.
- 1.3475-1.3500 is the key resistance area. Formerly support, this zone acted as strong resistance post the BoE meeting. Break that and we could be heading sharply higher.