
Nasdaq Talking Points:
- Last week produced a rare event with the Nasdaq 100 going into oversold territory on the daily chart for the first time since April of last year.
- The index is trading through a massive spot of support-turned-resistance this morning and that sets the stage for a re-test of the 29k level that held the highs last week in Nasdaq futures.
I looked into this coming into the week, as both the Nasdaq 100 and NVDIA pushed into oversold conditions on the daily chart. And for two markets and trades that have been ripping with aggression, that’s become a rare event, and the last time that happened for either was back in April of 2025. Of course, at the time, there was fear of the tariff tantrum, driven by the thought that President Trump was going to press tariffs even as equities began to sell-off. That, of course, didn’t play out, as it was around those April lows that Trump ultimately softened on tariff implementation and, in-turn, stocks jumped.
Our current episode is a bit different, however. To be sure, there is a lever that Trump has some element of control over with Iran and the impact on oil prices, but perhaps more to the point, it’s the fear of a bursting AI bubble, driven by higher US Treasury rates that has taken over headlines and this is a factor that President Trump doesn’t have as much control over. Unless, of course, he wanted to institute some element of austerity which would be a challenge given recent election results.
Nonetheless, as I’ve been highlighting in videos for StoneX, I don’t think this is the bursting of the bubble at this stage as there’s simply to enough pressure to continue forced selling whilst at lows. And, sure enough, it was after stocks pushed into oversold territory that we saw buyers show up, and this further highlights how unless there’s some overriding reason for selling while oversold or while at lows, we can simply see that bullish response that’s become so customary in US equity markets.
This content was created by an affiliate of FOREX.com and represents the views and opinions of the author/speakers, not the views and opinions of FOREX.com, StoneX Group Inc., or its subsidiaries. The content has not been independently reviewed by FOREX.com.
At this point, the Nasdaq is bouncing from a huge level, and I talked about this two weeks ago before the break down in that week’s Top 5 Charts video. This was resistance twice, back in October of last year and then in January of this year, and it’s now shown up for support.
Nasdaq 100 Weekly Chart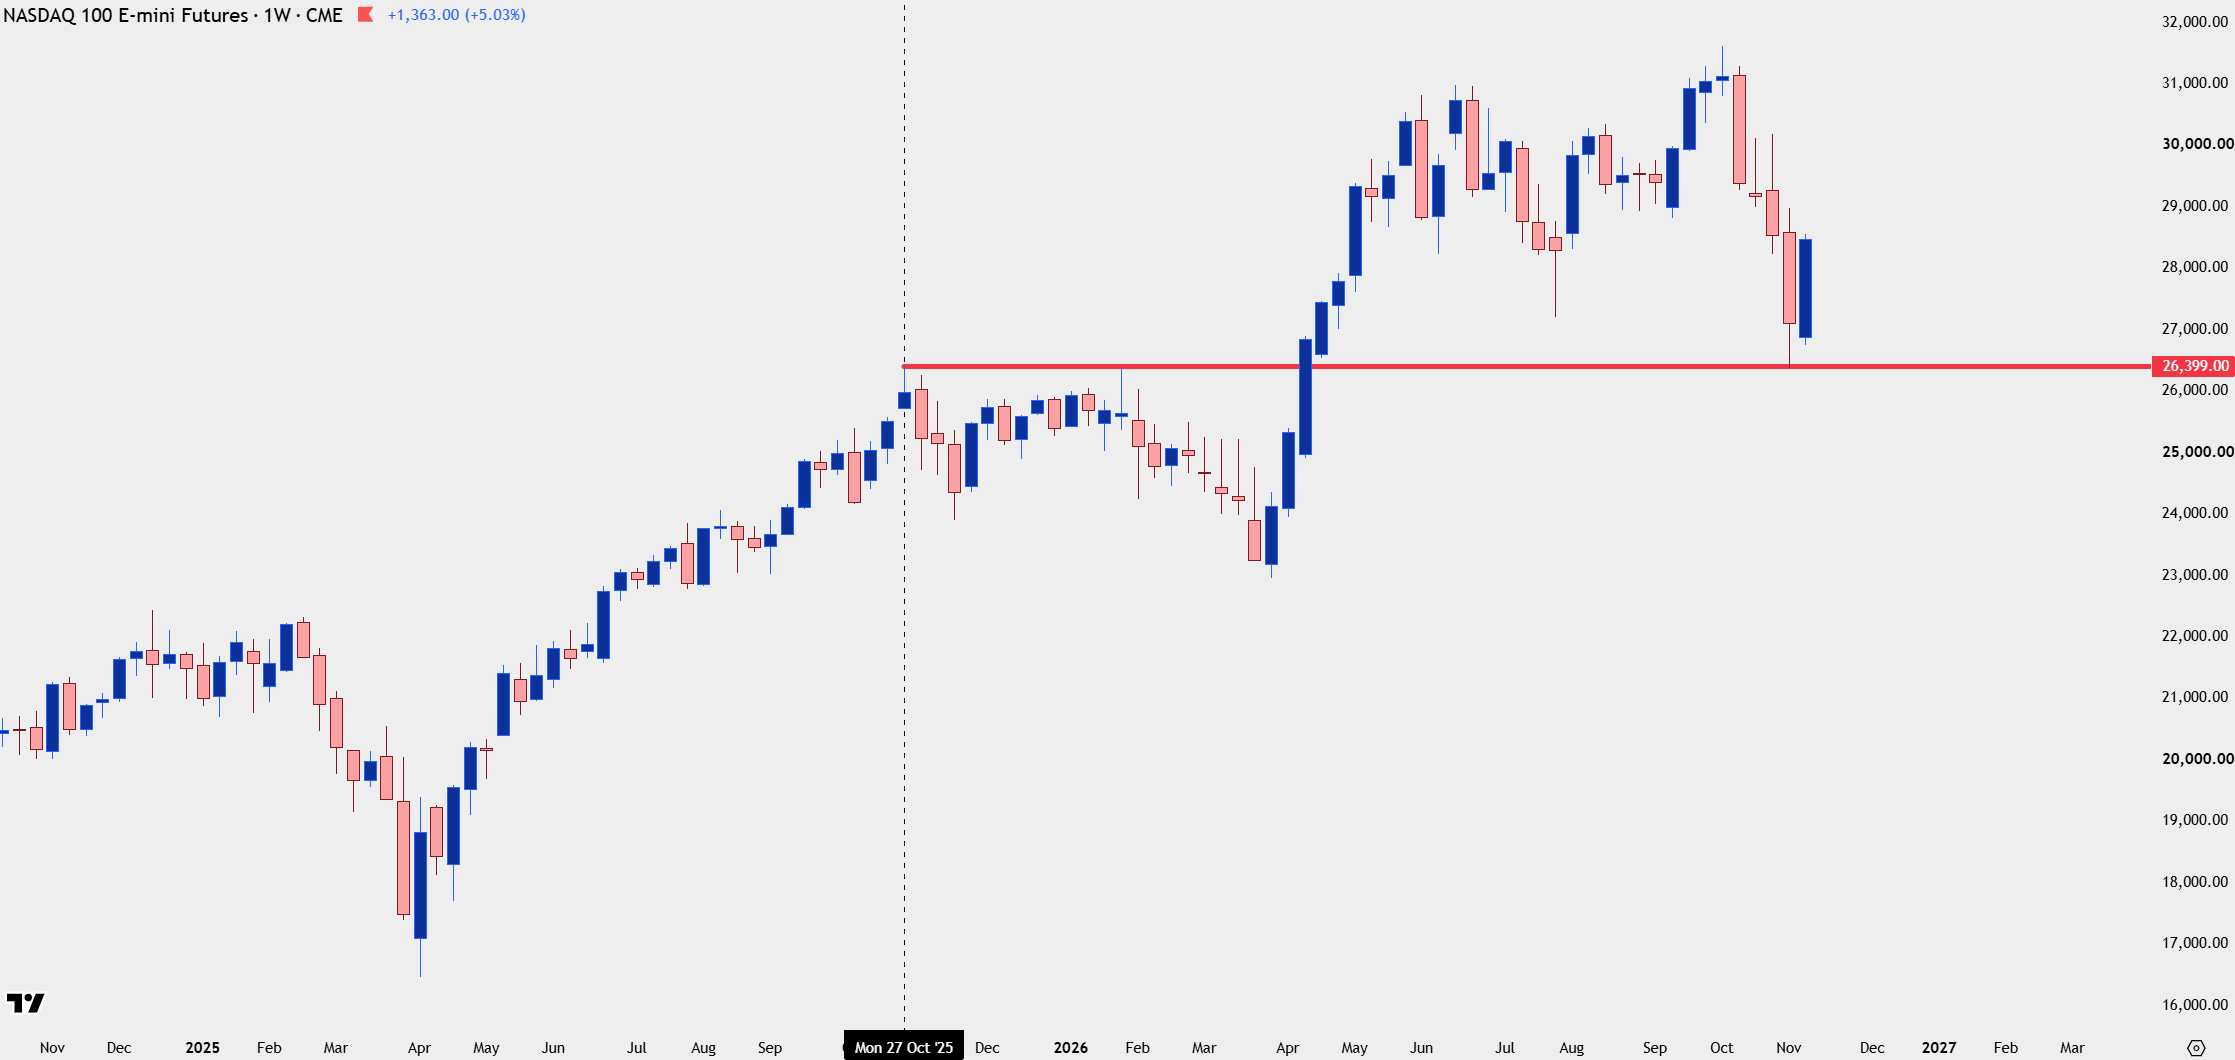
Chart prepared by James Stanley; data derived from Tradingview
Nasdaq Current Test
At this point NQ is grinding through a spot of prior support around the 28,310-28,391 area and this and held the lows back in May. But perhaps the more notable area is the resistance that set in last Thursday before the sell-off into oversold took over, and that plots right around the 29k area. If bulls can get above that, the next major zone is the 30k spot that held resistance twice in late-October.
Nasdaq 100 Daily Chart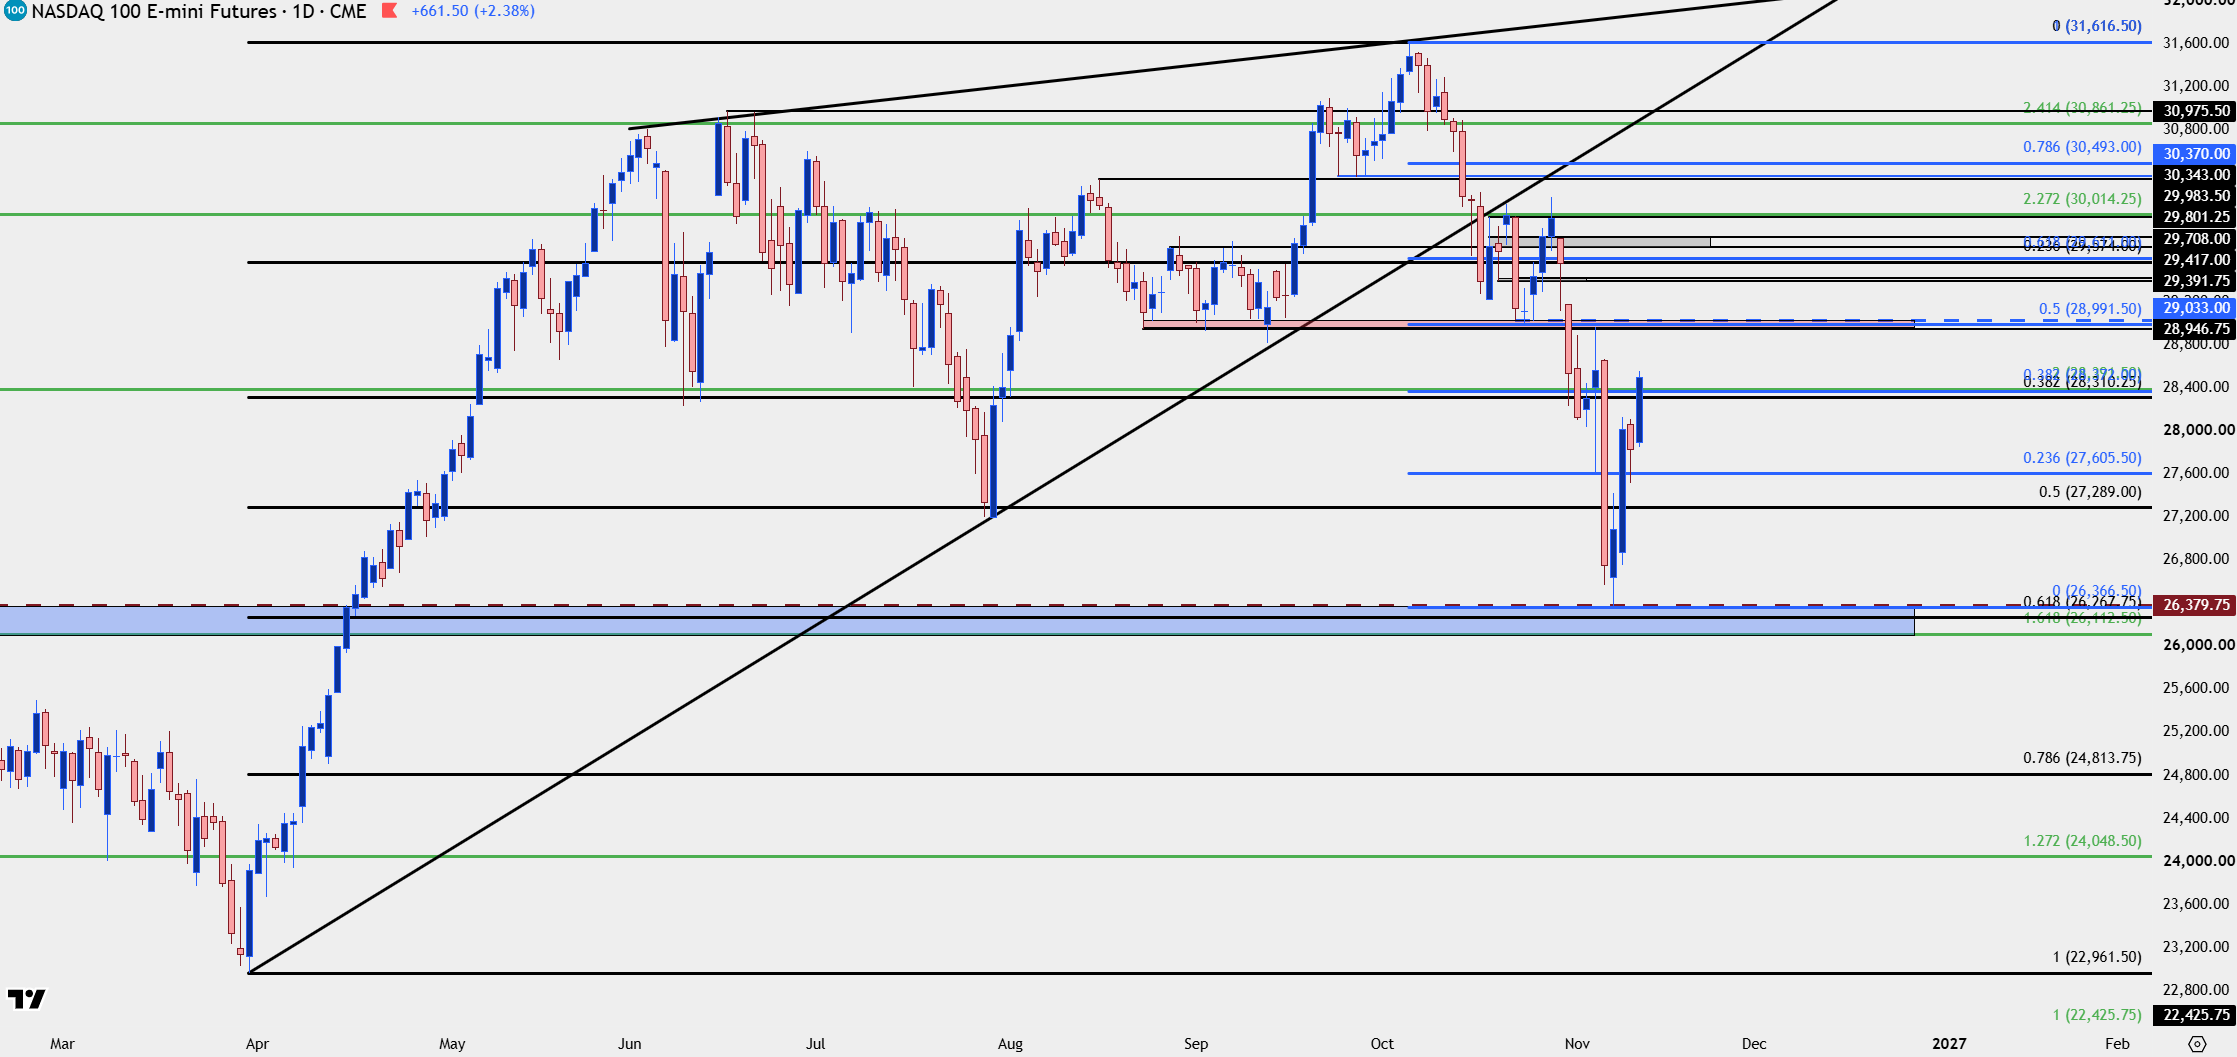
Chart prepared by James Stanley; data derived from Tradingview
Nasdaq: Now’s the Test
Whether this is a bear market rally or a resumption of prior trend will avail itself in the coming days.
On a short-term basis, there’s now a higher-high to go along with a higher-low from yesterday, which printed around the 23.6% Fibonacci retracement of the recent sell-off. This sets the stage for re-test around that same 29k area, which now has the 50% marker of that recent bearish move in the same zone that was in-play before. And related, the 38.2% retracement rests in that same 28,310-28,391 zone that was holding as resistance until earlier this morning.
If or when that sequence of higher-highs and lows breaks down, this will begin to look like it was fueled by short-covering. But, for now, traders can look for short-term higher-low support at either 28,310 or 28,129 for bullish resumption.
Nasdaq 100 Four-Hour Chart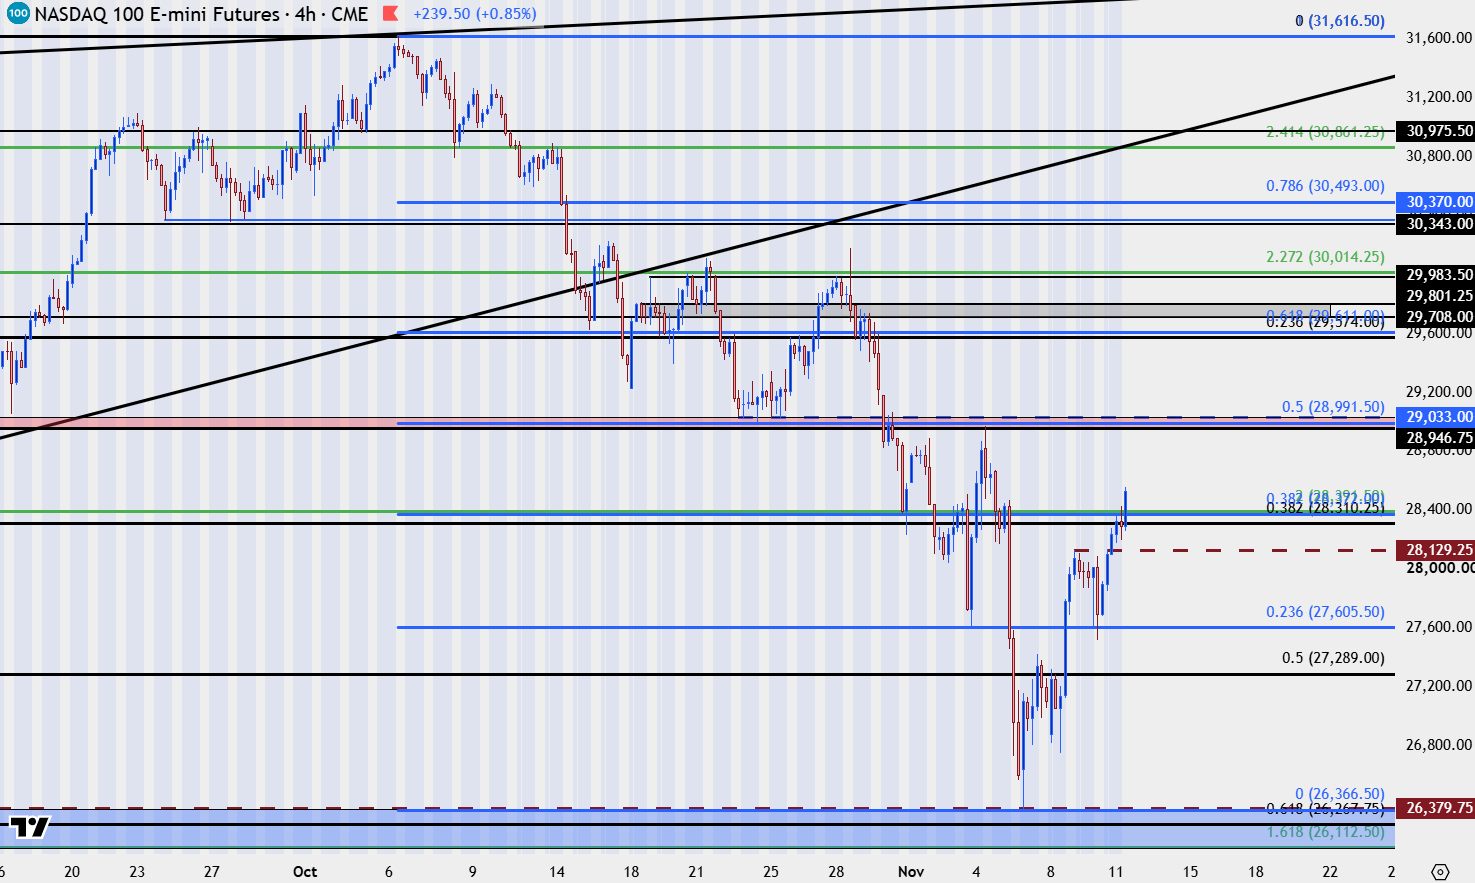
Chart prepared by James Stanley; data derived from Tradingview
--- written by James Stanley, Senior Market Analyst, Global Macro