Recent sessions have been particularly challenging for silver prices in the short term. Selling pressure has intensified considerably, resulting in three consecutive losing sessions and pushing the metal to a decline of nearly 8.5% over this period. This move has taken silver back to its lowest levels of the year and reflects a loss of market appeal that has become increasingly evident in recent trading activity.
Part of this weakness can be attributed to the performance of the U.S. dollar and the bond market following the release of U.S. inflation data. Expectations of higher interest rates have increased the attractiveness of alternative markets that compete with precious metals for investor capital, reducing the room for a meaningful recovery in silver prices. As long as this environment remains in place, the bearish bias around XAG/USD could continue to dominate market activity in the sessions ahead.

Are Inflation Numbers Reinforcing Silver's Weakness?
The latest U.S. inflation figures were released during today's session. Annual CPI came in at 3.7%, above the market expectation of 3.6%, while Core CPI rose 2.6% year-over-year, also exceeding forecasts of 2.5%.
The importance of these figures lies in the fact that inflation continues to show difficulty moving lower and remains well above the 2.0% target established by the Federal Reserve. As a result, expectations have strengthened that the central bank could maintain a more aggressive stance in the coming months.
This situation is particularly important for silver because both the bond market and the U.S. dollar tend to benefit in environments where interest-rate expectations move higher. Since silver does not generate a direct yield, it often becomes less attractive when competing assets perceived as relatively stable begin offering higher returns.
The impact of this dynamic has been clearly reflected across financial markets. On one hand, 10-year U.S. Treasury yields continue to trade near the 5.2% area, historically elevated levels that remain attractive to investors. At the same time, the DXY, which measures the U.S. dollar against its major counterparts, continues to hold above the 102-point mark, reflecting sustained demand for the greenback even after the inflation release.
Silver has moved in the opposite direction. While both Treasury yields and the U.S. dollar continue to display strength, the precious metal has remained under pressure, suggesting that these competing markets continue to absorb some of the demand that would otherwise flow toward silver.
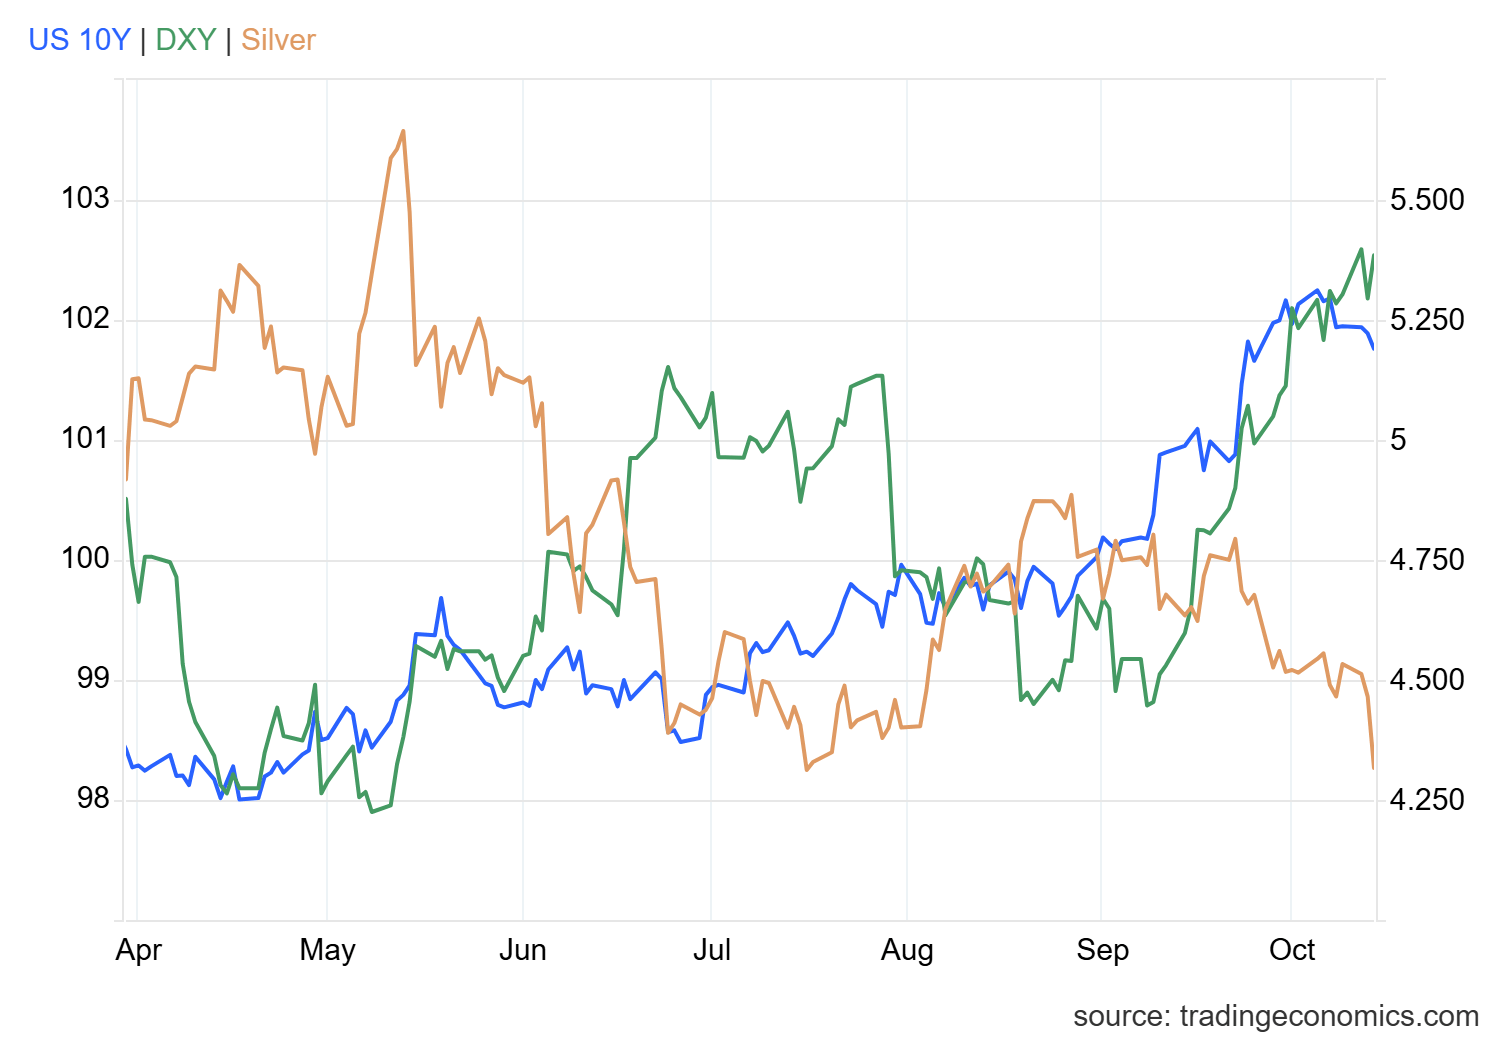
Source: TradingEconomics
Taking all of this into account, expectations of a more aggressive Federal Reserve have increased the opportunity cost of holding precious metals relative to assets that generate yield. This dynamic became particularly evident following the inflation release and could continue limiting silver's ability to recover in the short term. As long as the U.S. dollar and Treasury yields continue to benefit from expectations of higher interest rates, the selling pressure surrounding XAG/USD could remain an important feature of market activity.
Gold-to-Silver Ratio
Another important factor within the precious metals market is the evolution of the gold-to-silver ratio, which has climbed toward the 73 area after reaching lows near 64 at the end of September.
This implies that a growing number of ounces of silver are required to purchase one ounce of gold and reflects the weaker relative performance of silver compared with gold over recent weeks.
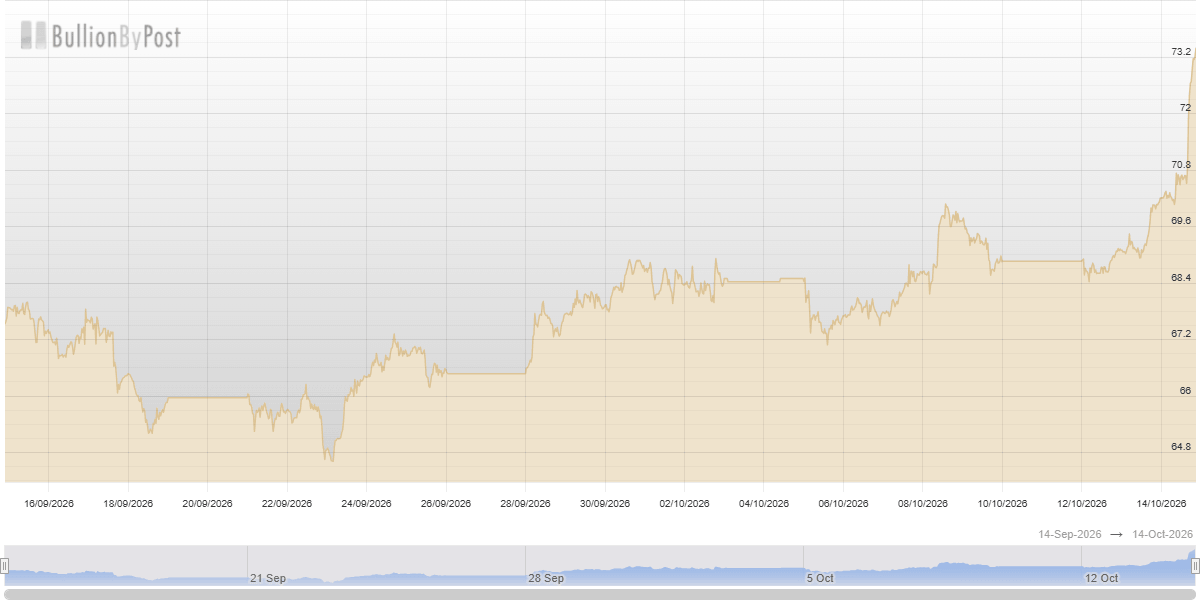
Source: Bullionbypost
The steady increase in this ratio suggests that investors are favoring gold over silver within the precious-metals space. Recent market reactions to macroeconomic developments show that silver remains more sensitive to expectations surrounding monetary policy and broader financial market conditions.
Not even silver's industrial component has been enough to stabilize demand in recent sessions. Instead, the market appears to be placing greater emphasis on gold as the primary safe-haven metal. This indicates that silver is not only losing attractiveness against alternative markets such as the U.S. dollar and bonds, but also against a closely related asset like gold.
As long as the ratio continues to advance and silver's relative weakness against gold remains evident, this situation could continue to reflect fading confidence in the metal and support ongoing selling pressure around XAG/USD in the sessions ahead.
Silver Technical Forecast
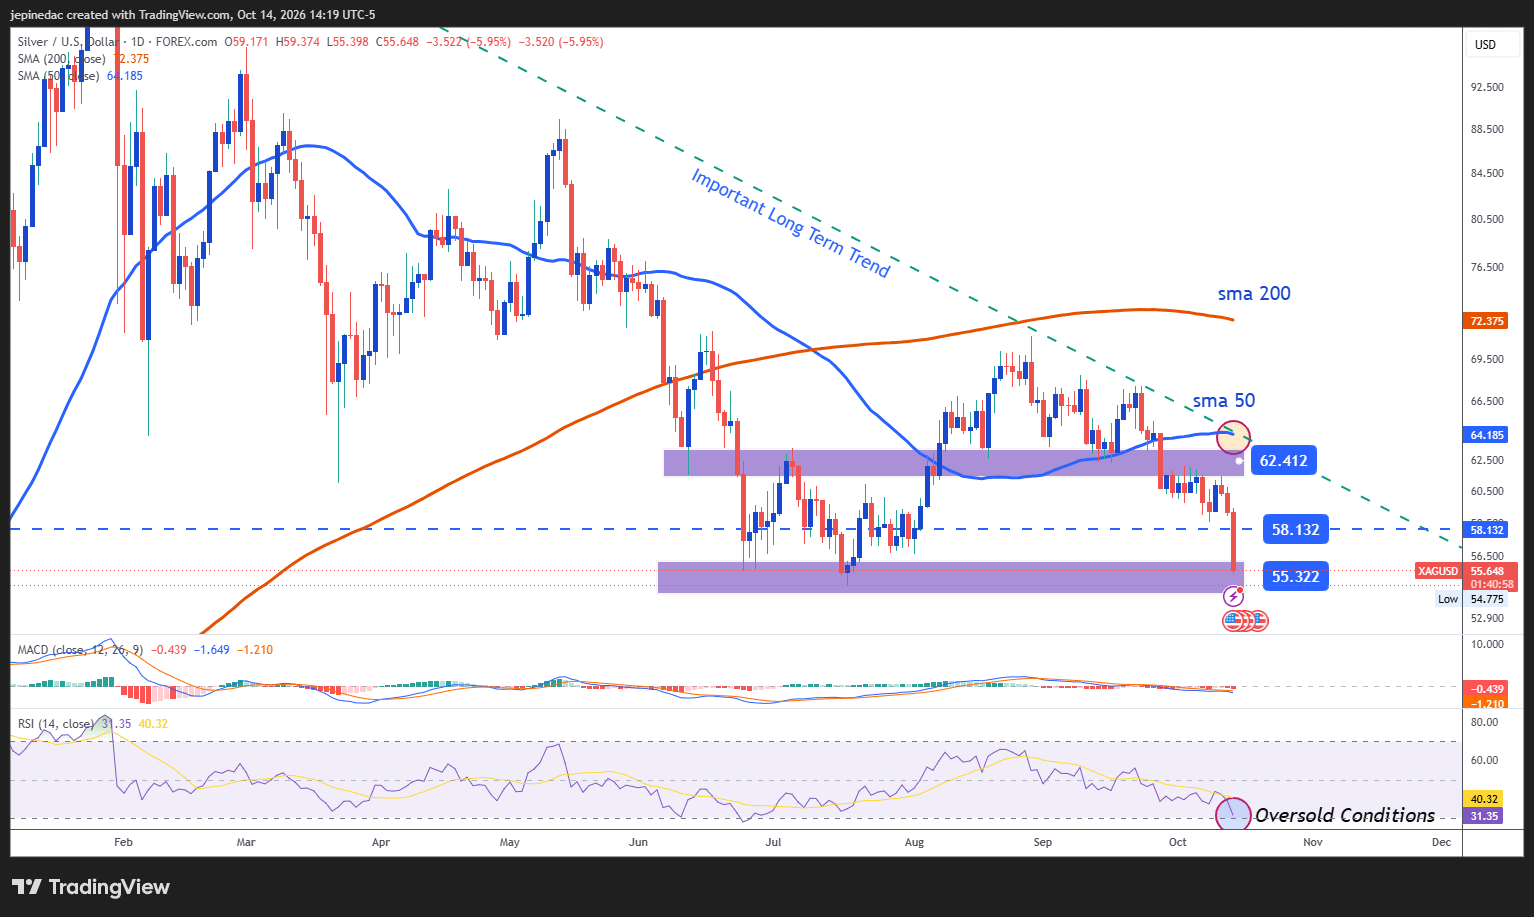
Source: StoneX, Tradingview
- The major bearish trendline regains relevance: Since the early months of 2026, silver has been developing within a broader bearish structure that has led to the formation of a significant long-term downtrend. The recent acceleration in selling pressure has returned focus to this trendline and, as long as key support levels continue to break lower, the broader bearish structure could once again become the dominant technical pattern to monitor over the coming weeks.
- MACD: The MACD histogram continues to trade below the 0 neutral line, reflecting that short-term moving-average momentum remains tilted in favor of sellers. As long as this reading remains intact, bearish pressure could continue to dominate market movements.
- RSI: The RSI is showing a similar picture, remaining below the 50 neutral level. However, the indicator is also approaching the 30 oversold zone, a development that could signal excessive recent selling pressure and create room for short-term bullish corrections.
Key Levels to Watch:
- $62 – Critical Resistance: This level aligns with the long-term bearish trendline and the 50-period simple moving average. Price action that manages to develop consistently above this reference could begin to challenge the dominant bearish structure and open the door to a more neutral trading environment.
- $58 – Near-Term Barrier: An important retracement area observed over recent weeks that could become the primary level to monitor in the event of short-term bullish corrections.
- $55 – Critical Support: This level coincides with the lows of the year and remains the most important downside barrier on the daily chart. Sustained moves below this area could reinforce the dominance of the bearish bias and support a further extension of the current downtrend in the weeks ahead.
Written by Julian Pineda, CFA, CMT – Market Analyst
Follow him on: @julianpineda25