Well, they finally did it. The Bank of Japan intervened in markets on Thursday morning and drove a sell-off of more than 400 pips in the USD/JPY pairv. This had a big impact across the board and as I was discussing back in February when USD/JPY was selling off, that USD-weakness showed in many other areas of the market, including EUR/USD and GBP/USD.
The reason why something like this can be so impactful is the built-in carry trade on the major USD/JPY pair. Even after this week’s effort the pair remains 50% above early-2021 levels, and the only way a move like that can build is with a lot of demand against smaller supply. Normally, a one-sided move of that nature will rectify as the backing fundamentals shift but to this date, the Bank of Japan appears reticent to do that and looking at the full picture there’s quite a few reasons as to why.
USD/JPY Weekly Chart: 160 An Important Line in the Sand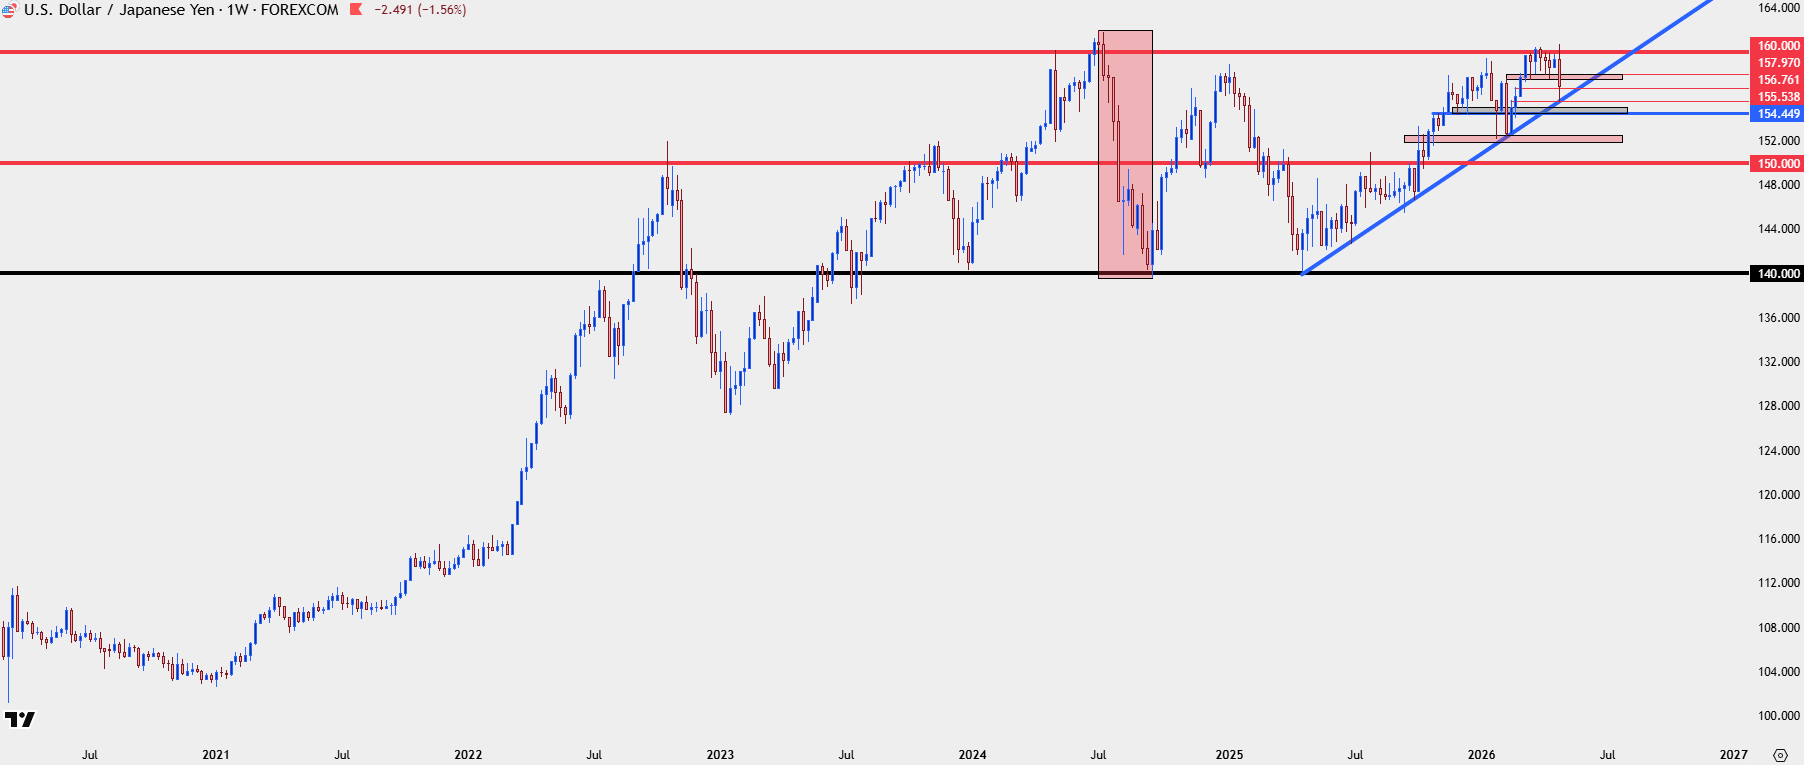
Chart prepared by James Stanley; data derived from Tradingview
The question now is whether inflation will force their hand and this has linkage to the ongoing conflict in the Middle East, as higher oil prices can seep into other areas of the economy and if inflation continues to ramp, the BoJ may simply have no choice but to lift rates which will narrow the differential between the US and Japan and, in-turn, cause at least some of those longs still holding on to cut the trade.
This isn’t without consequence, however, and we got a taste of that back in July of 2024, when the BoJ intervened on the morning of a US CPI Print. This was just a couple of months after a failed intervention on the first test of 160.00, in what essentially amounted to the BoJ burning capital on a move that traders simply faded a week later. But in July, that intervention hit right as weaker inflation hit the US, driving odds higher for rate cuts in the United States. The combined force of BoJ intervention and narrowing rate expectations was enough to push some longs out of the market. But that’s where the collateral damage started to come in:
The carry trade isn’t just retail traders buying the high-yielder and selling the low-yielder. There’s an actual dynamic behind it, as well, as funds and institutions can go to banks in Japan to borrow capital at low rates and then turn around and invest that cheap capital in economies with higher rates, looking to pocket the spread between the two.
The only problem in that situation is currency risk, as the institution getting the loan from Japanese banks is getting that loan in Japanese Yen, and if JPY is sinking in value any gains seen from the spread may simply evaporate. So, the logical thing to do is to hedge that risk by selling JPY in the market and buying another currency, such as the USD. This puts more push on the long side of the pair as carry trades look to hedge currency exposure.
But when that trade starts to go the other way – so too can the markets that had benefited from that leverage, and this is what we saw in July of 2024 as a rapidly declining USD/JPY came along with a strong sell-off in tech stocks in the US. It didn’t take long for the media to make the connection, pointing the finger at the Bank of Japan’s intervention as the spark point for the sell-off.
The BoJ quickly moved into a more neutral stance and by September of that year, a couple days ahead of the FOMC cutting rates, the pair bottomed at 140.00 and began to move higher, again driven by the still one-sided carry in the pair.
Since then, 160.00 has been an important line in the sand. In 2025, traders didn’t even want to test that price. More recently, however, it’s become more of an ordeal and this week, just ahead of the FOMC, traders went for the break and that’s when the BoJ jumped in to intervene again.
The issue now is that this intervention, at least so far, has been rather weak compared to prior episodes. When they intervened on the first 160.00 test in April of 2024, price dropped all the way down to 151.95, which was the high in 2022 and 2023. And then of course in the July episode that year, price set a fresh high at 161.95 and then dropped by more than 2,000 pips, although there was also the help of weaker US data and rising odds of US rate cuts.
We don’t quite have that right now and if anything, the prospect of higher inflation both for the US and Japan remains the elephant in the room given the ongoing conflict in the Middle East.
At this point, the intervention has been a mere pullback and price has so far held at a bullish trendline, and above the 155.00 level. I’m still construing this as bullish and if there is a deeper drop, there’s supports at 154.45-155.00 and then 151.95-152.50. If we get below the 150.00 level, my assumption is that something in the backdrop would have changed, and it would then be time to change stance and instead look to longer-term mean reversion.
USD/JPY Daily Price Chart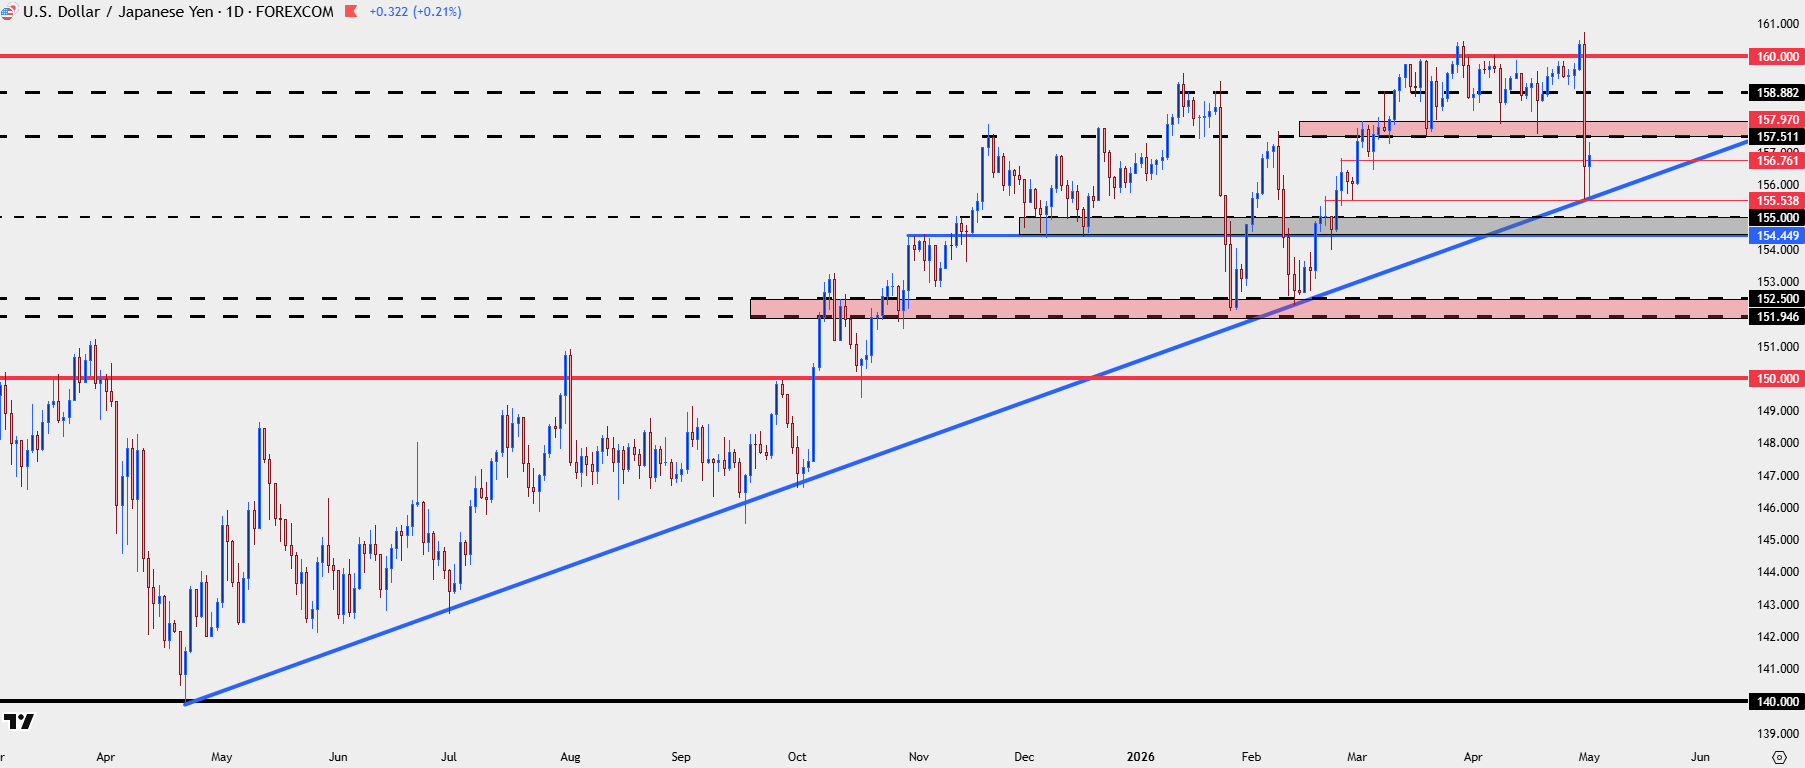
Chart prepared by James Stanley; data derived from Tradingview
US Dollar
I wanted to lead today’s article with USD/JPY as I think that’s still the driving force behind the USD and, in turn, the FX market. If we do see greater unwind of that crowded carry trade then I think we can see USD values drop, which would then lift markets like EUR/USD and GBP/USD.
That said, I don’t think that USD/JPY is the cleanest place to play themes of USD-weakness, as we saw during the week those moves can be violent and aggressive and very difficult to chase. Instead, markets like EUR/USD can show clean technical items which I talked about on Thursday and which remain in-place today.
I think there is another important consideration here, however, and that’s the fact that it seems both the US and Japanese side want a weaker spot rate in USD/JPY. Traditionally, one-way interventions from Japan have not fared well. They’ve either needed direct assistance from the US, such as what happened in 1998, or they need some help from US data and rate expectations, like we saw two years ago.
As noted above, this could, of course, come with consequence, so I think more than trying to push a full-fledged reversal both parties would prefer some dynamic of stability with prices generally holding below the 160.00 big figure. But predicting something of that nature is a shot-in-the-dark as this would be a very unusual occurrene and I think it’s something that would need to happen after another 160.00 test rather than before. And perhaps even something that wouldn’t create a sense of urgency until prices were rallying up to a 161.95 or 165.00 type of level.
For now, I’m still looking to USD/JPY as my preferred long USD market as the fundamentals still justify that until we see some shift either in US or Japanese rates. In DXY itself, price is testing a key spot of support following the Thursday sell-off that was fueled by the USD/JPY intervention.
US Dollar Daily Price Chart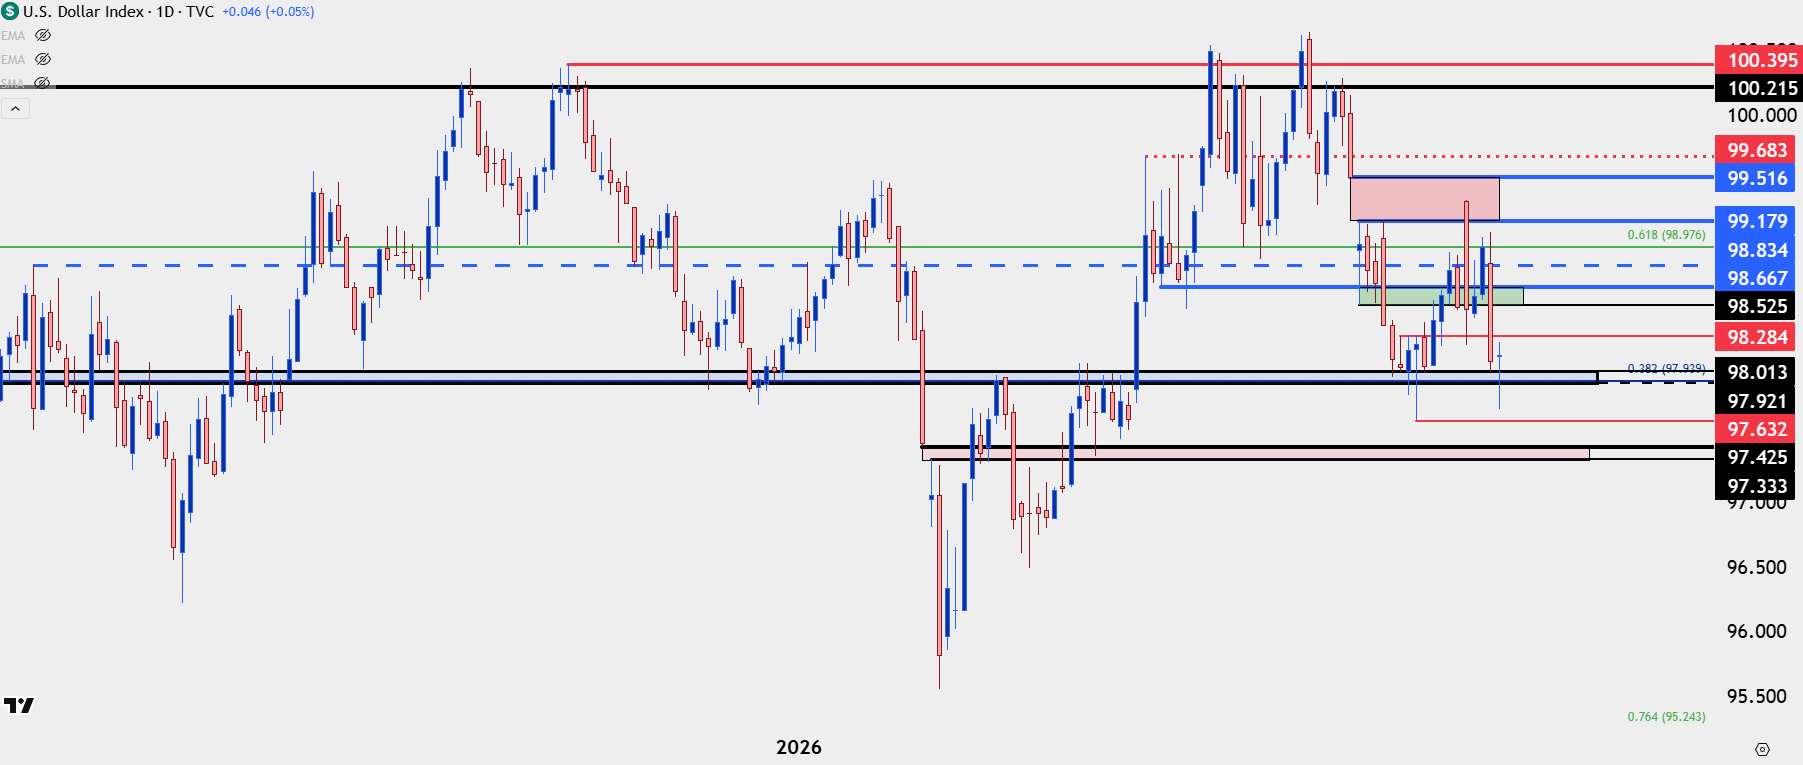
Chart prepared by James Stanley; data derived from Tradingview
EUR/USD
Seasoned traders often look to operate away from the fireworks rather than with them and that’s somewhat of my logic for tracking EUR/USD as a preferred setup for USD-weakness. As I discussed on the Tuesday webinar, if we did get an intervention, I was expecting the move to be fast and violent, with the type of momentum that necessitates guesswork to follow or fade. Instead, there was a still-bullish backdrop in EUR/USD that had been mired in a pullback and it was the 1.1655 level, the very top of the support zone that I was tracking then, that came into play to hold the low.
At the Thursday ECB meeting, Lagarde sounded hawkish, saying the bank even debated a rate hike on the day. And that helped EUR/USD to break out of a falling wedge which is a bullish reversal formation, and rally up to a fresh higher-high, right at the 1.1742-1.1766 zone.
I still prefer EUR/USD as one of my setups for USD-weakness and I’m tracking two spots for higher-low supports, at 1.1699 and 1.1719, with key resistance overhead at 1.1833.
EUR/USD Four-Hour Price Chart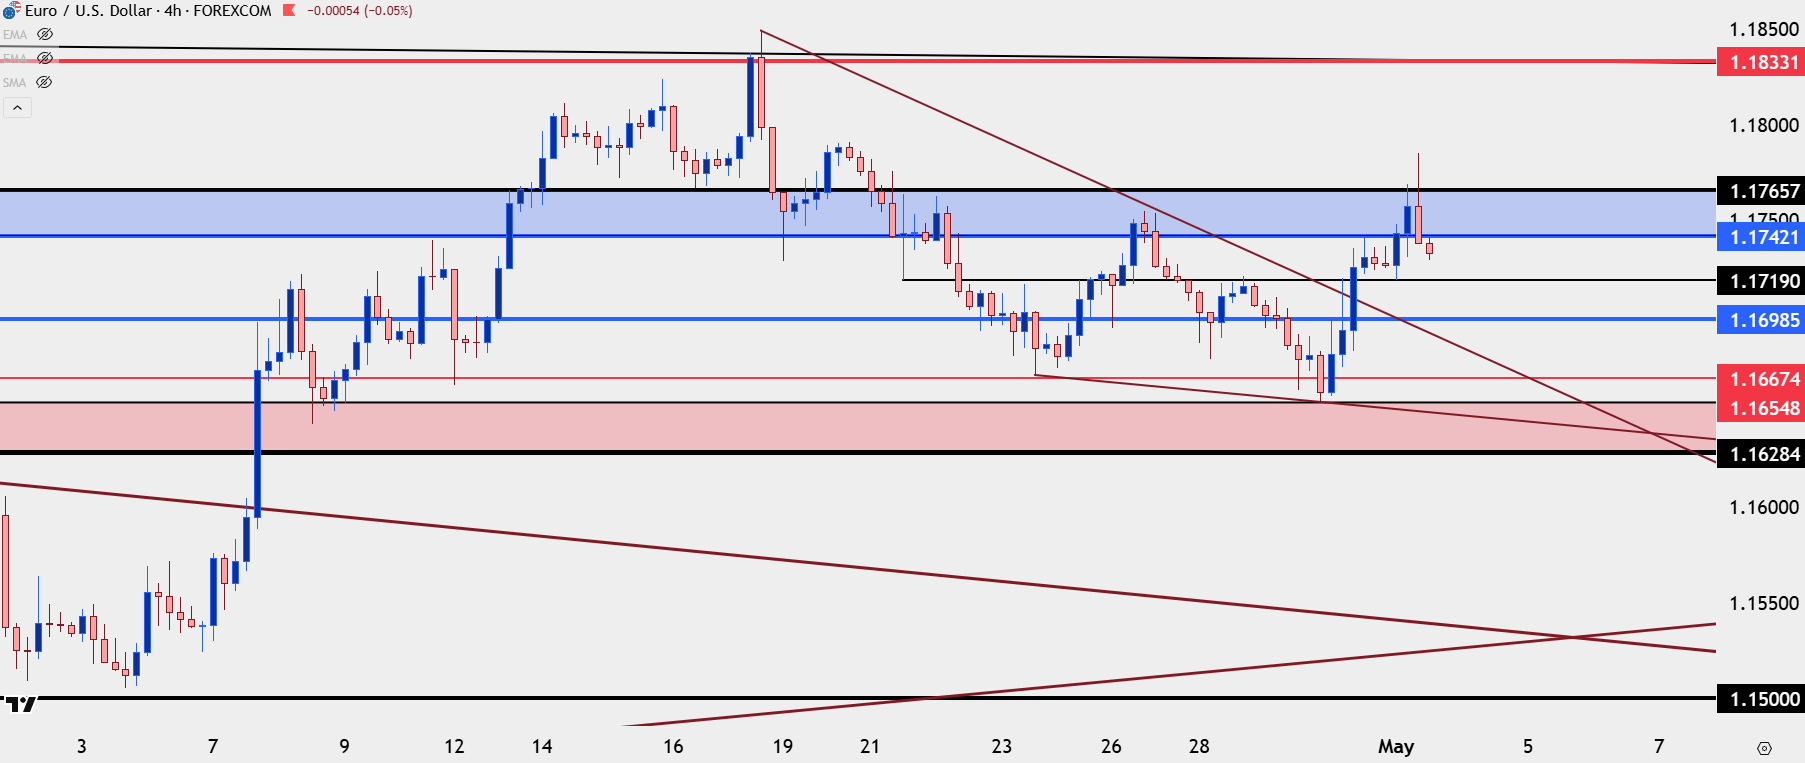
Chart prepared by James Stanley; data derived from Tradingview
GBP/USD
GBP/USD may actually have an even stronger case for USD-weakness setups and this was a near constant theme through the month of April. While EUR/USD remains below the April high, GBP/USD is already above it’s own high from last month following a strong break of prior resistance at 1.3600.
Similarly, I like this market for USD-weakness scenarios and given dynamics from the past week there are two areas from which higher-low support can be tracked. The 1.3568 level still carries some weight, as does the 1.3500 area that has been an active presence over the past couple of months.
GBP/USD Four-Hour Chart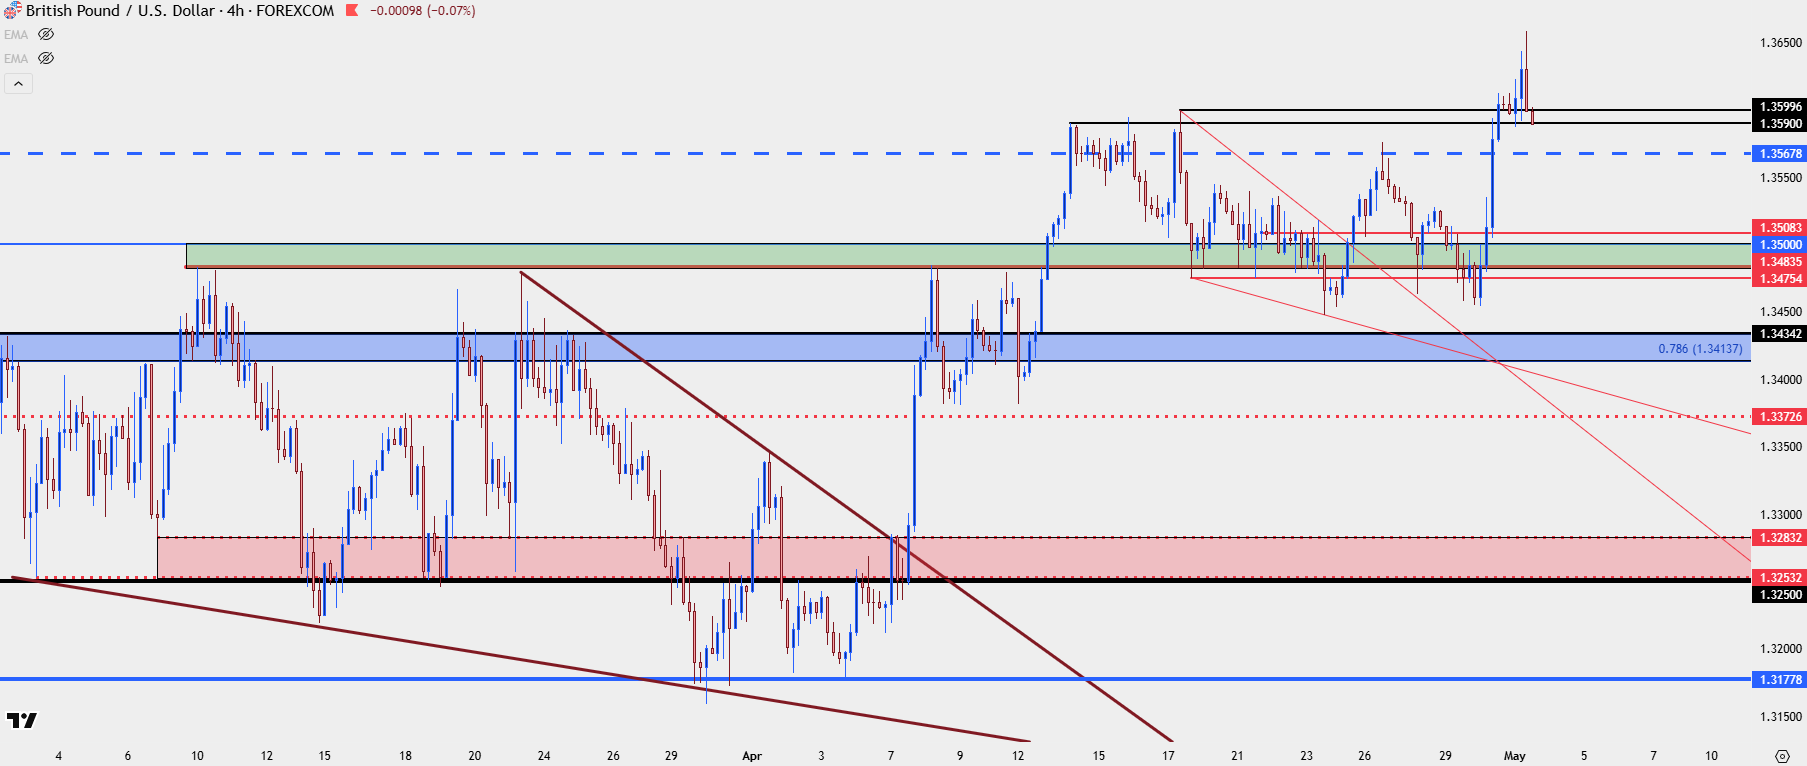
Chart prepared by James Stanley; data derived from Tradingview
--- written by James Stanley, Senior Market Analyst, Global Macro