On Friday the US Dollar was testing support in the ascending triangle formation but for the past month and change the currency had held up fairly well as the USD/JPY rally came back to life. As I covered in the Friday article and video, I still think that USD/JPY is a primary push point for the DXY basket which then carries impact into EUR/USD, GBP/USD and other USD pairs, but with the weekend events in Iran both the US Dollar and USD/JPY broke out in a big way to start the week.
Now we have the challenge of proximity to the 160.00 level in USD/JPY; a price that has already brought out threats of intervention from the Japanese Finance Ministry. Perhaps the comment that was most impactful came in late-January, just before the BoJ-fueled reversal in the pair, in which Finance Minister Katayama in Japan mentioned that she had spoken with US Treasury Secretary Scott Bessent, and they shared the opinion that a stronger spot rate in USD/JPY was something both would prefer not to see.
This makes sense as further Yen-weakness threatens higher inflation rates in Japan and, in-turn, higher bond yields which makes it more expensive for the government to borrow money. And for the US Dollar, President Trump has been quite vocal about his desire for a weaker Dollar on numerous occasions since his inauguration a year ago. With two of the world’s largest national central banks wanting the same thing, it seems a tough fight to bet on the other side of the argument and this is perhaps one of the major reasons that the pair put in a lower-high after the BoJ meeting in late January before falling by 800 pips in just a few days.
As I covered then, USD/JPY can still be attractive on the long side provided that price is further away from recent highs. But as we get closer to that 160.00 level the perceived risk-reward for upside plays gets less and less attractive, and this can lead to a run of selling similar to what showed both in late January and then again in February.
Now, we’re testing resistance at that same high that had stalled the move a few weeks ago and this is a difficult breakout to chase.
USD/JPY Daily Price Chart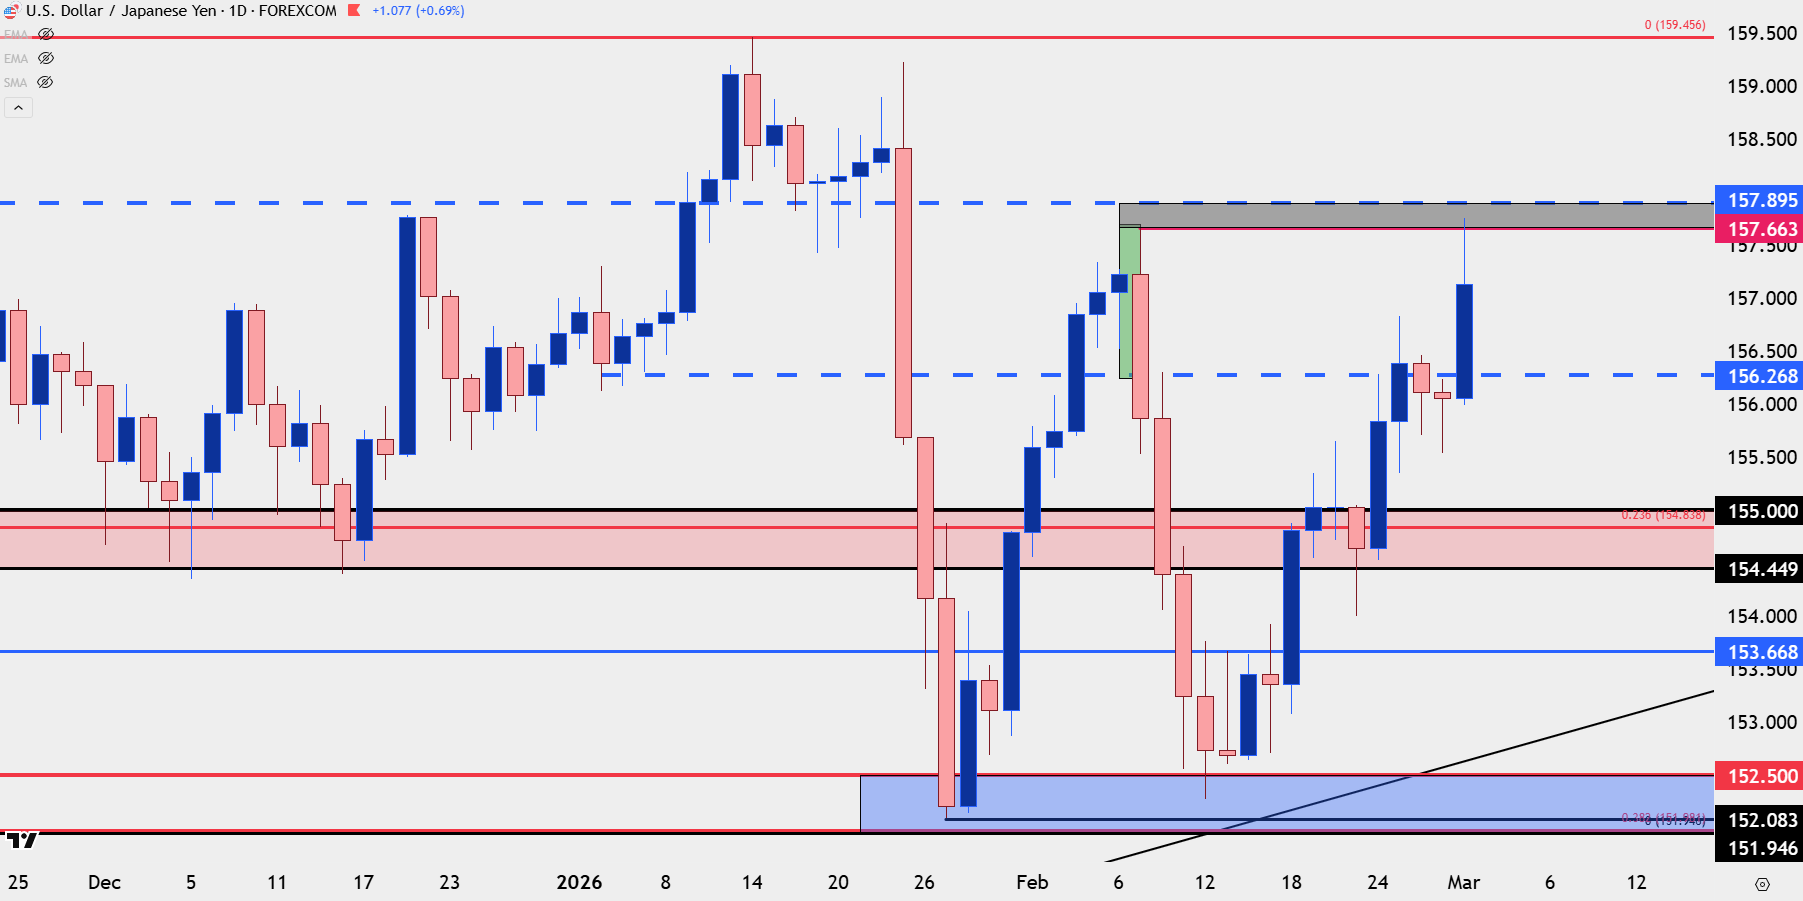
Chart prepared by James Stanley; data derived from Tradingview
US Dollar Dynamics
It’s still early so one should be careful not to read too much into it, but the breakdown in EUR/USD has negated a falling wedge formation and price has also pushed through a massive spot of confluent support. If this Euro weakness is to continue, then, arguably, there could be another bullish catalyst for the USD that doesn’t involve USD/JPY.
But, that really only applies if USD/JPY doesn’t show aggressive bearish conditions similar to what happened in late-January. That episode appears to have been a brief but violent episode of carry unwind, which effectively pushed USD-weakness against several major currencies, the Euro included.
I’ll cover this in greater depth in the webinar tomorrow and you’re welcome to join, the link below will allow for registration.
In the US Dollar, it’s prior resistance from the ascending triangle that is now support potential.
US Dollar Daily Price Chart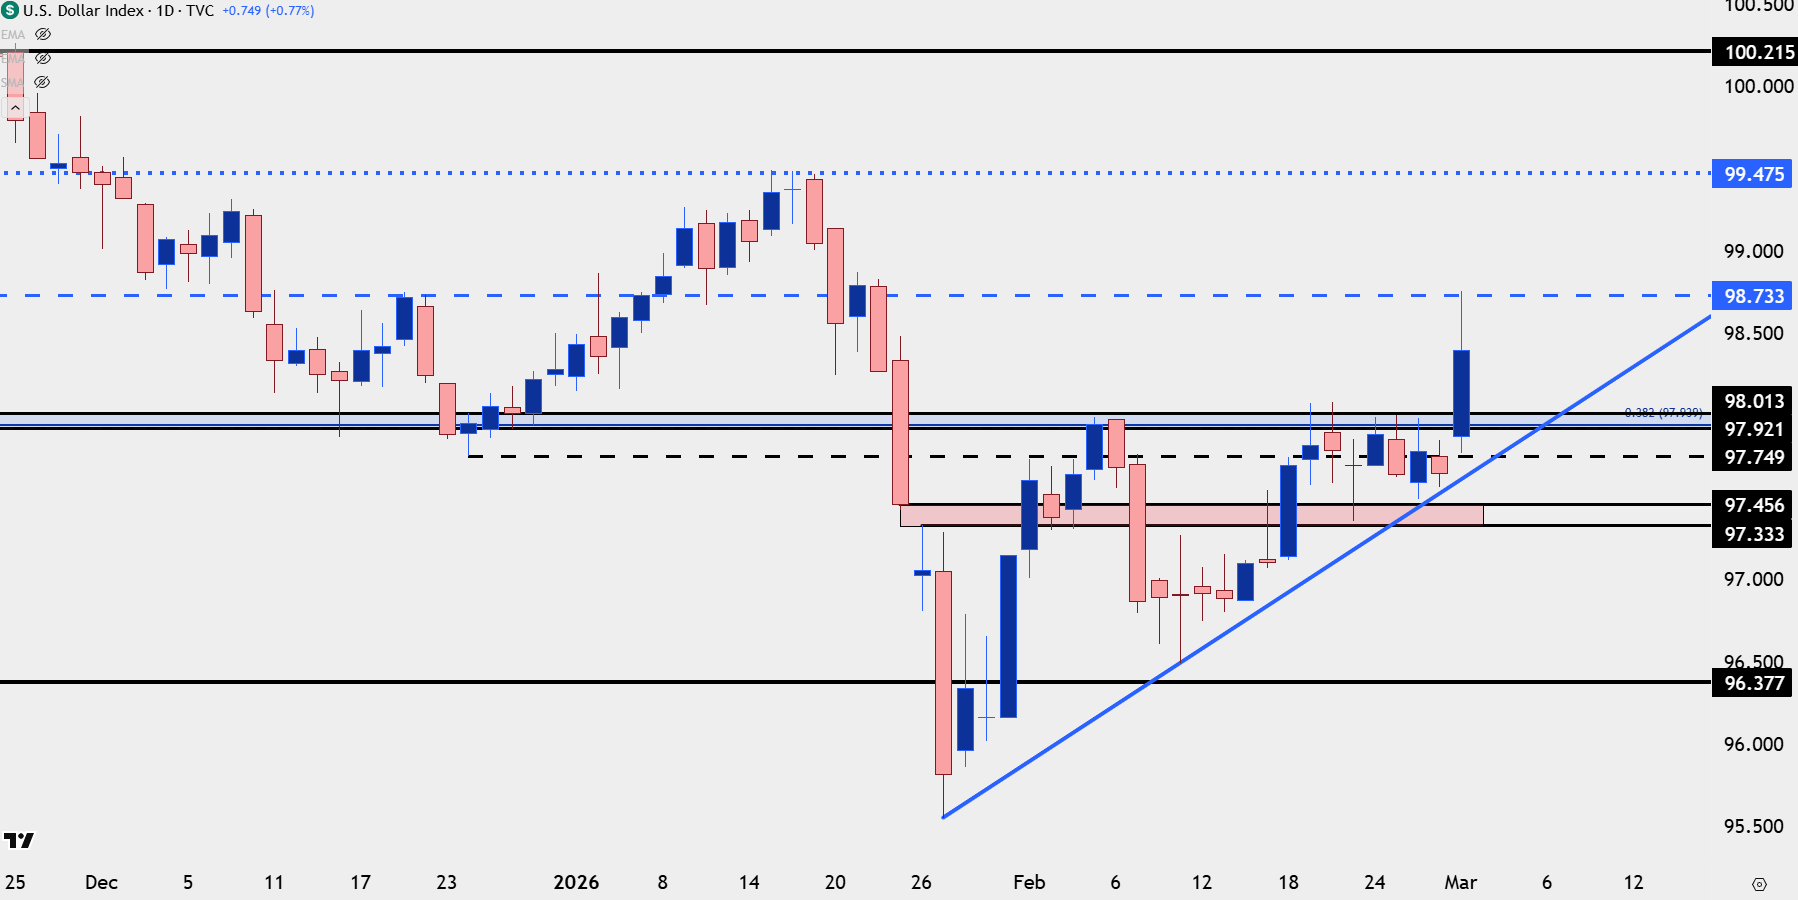
Chart prepared by James Stanley; data derived from Tradingview
USD/JPY Structure
While Chasing USD/JPY at highs or near this key resistance is unattractive, perhaps the better test for bulls is whether buyers show up at tests of potential support.
The 154.45-155.00 zone seems an obvious one as this has had multiple inflection points going back to October as both support and resistance. But, on a shorter-term basis, there’s the 156.27 level that was initially showing as resistance early last week, and that’s now a spot of possible support and if bulls remain aggressive, that could certainly function as the higher-low for the pair.
If 154.45 does not hold, however, it’s not necessarily ‘game over’ for buyers, as prior range resistance at 153.67 is of note, and then below that I’m considering invalidation from 151.95 up to 152.50. That’s the spot that has so far held two intense reactions after the late-January and then February sell-offs.
USD/JPY Four-Hour Price Chart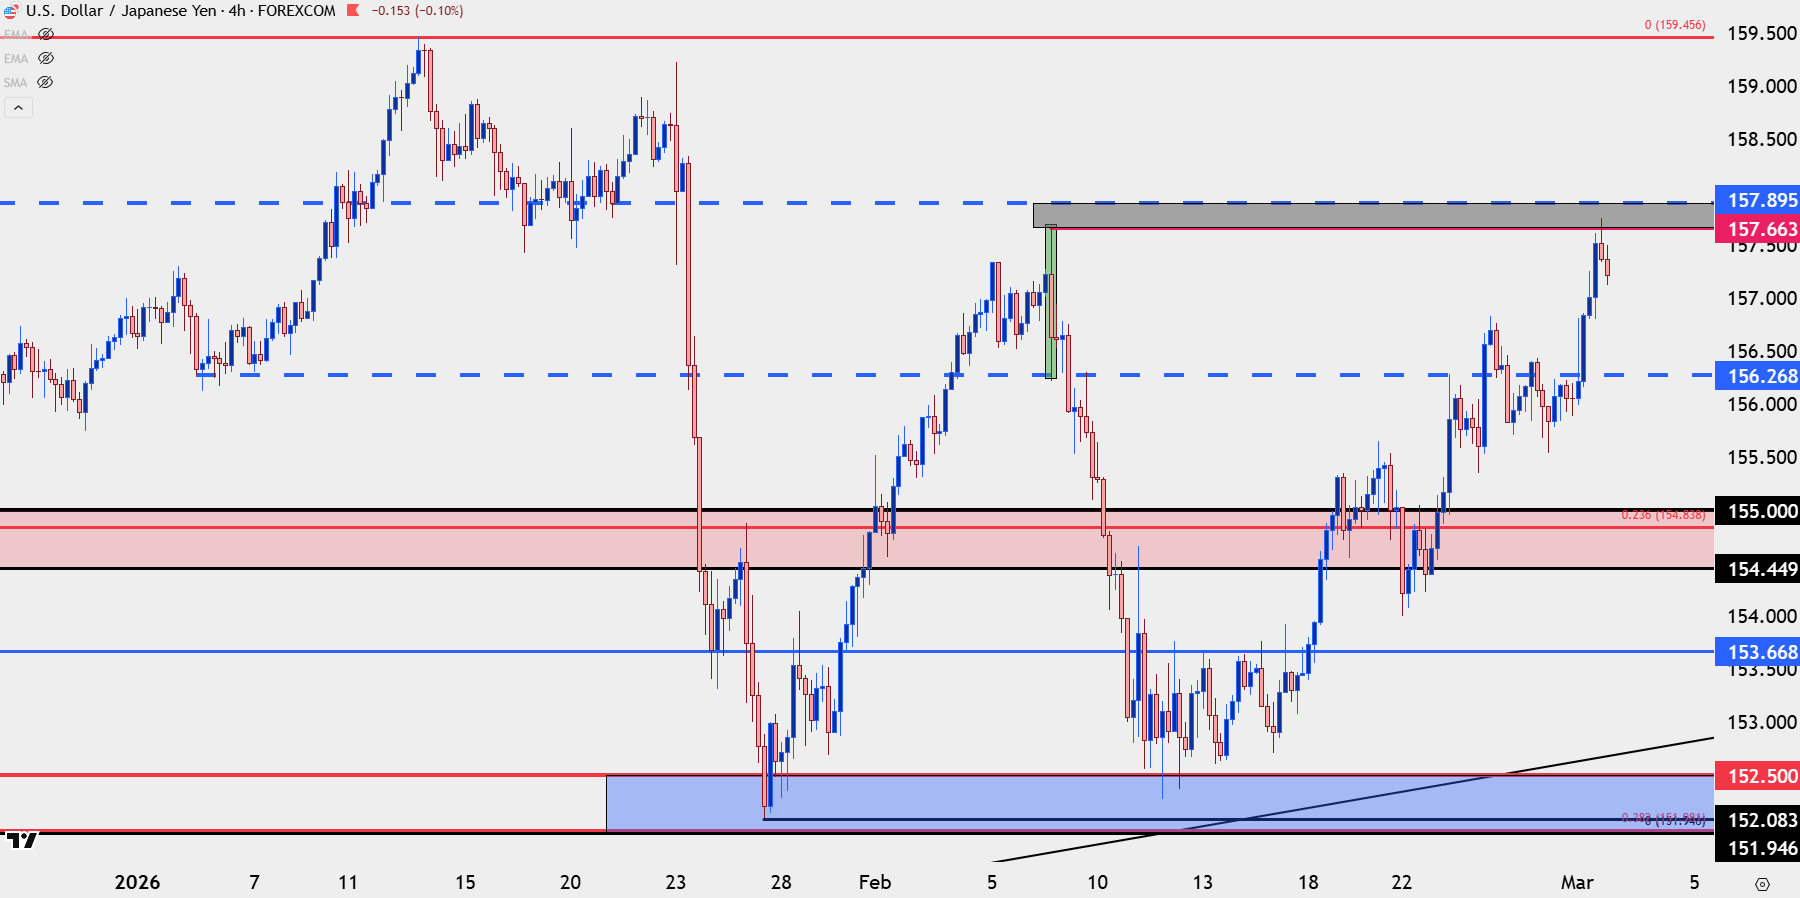
Chart prepared by James Stanley; data derived from Tradingview
--- written by James Stanley, Senior Market Analyst, Global Macro