



Crypto Outlook: Altcoins Lead the Rally as Bitcoin Pauses
With only a few days left in September, the cryptocurrency market continues to show a constructive short-term outlook. The latest trading week has delivered meaningful gains across most major digital assets and, broadly speaking, the bullish bias remains the dominant force within the market.
Share this:

With only a few days left in September, the cryptocurrency market continues to show a constructive short-term outlook. The latest trading week has delivered meaningful gains across most major digital assets and, broadly speaking, the bullish bias remains the dominant force within the market. However, it is becoming increasingly evident that key benchmarks such as Bitcoin are beginning to lose some momentum, with prices no longer posting new highs at the same pace seen days earlier. While several altcoins continue to record significant advances, BTC appears to be entering a phase of greater stability. This dynamic could help maintain a positive tone across the market in the near term, although it also raises the risk of renewed indecision if the leading cryptocurrency fails to sustain a stronger sense of market confidence.

Performance of Major Cryptocurrencies
Source: Data - StoneX, Tradingview
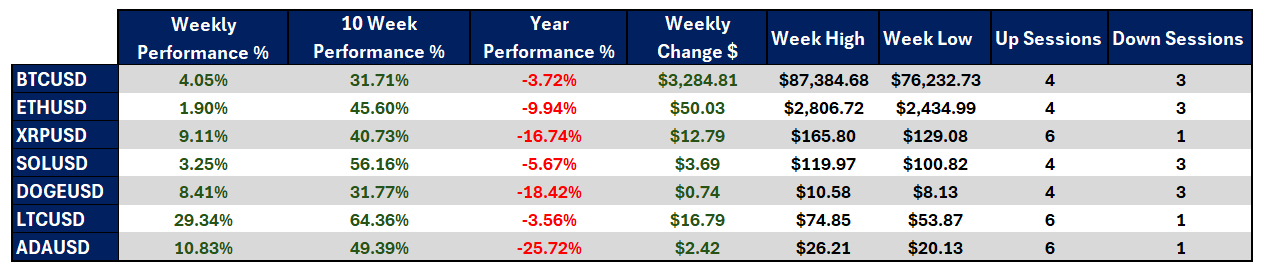
- The week remained positive for the broader cryptocurrency market, with virtually all major cryptocurrencies posting gains. However, the magnitude of those gains has become increasingly uneven across different assets, suggesting that buying pressure is no longer being distributed equally throughout the sector. In this environment, Litecoin stands out after gaining more than 29.00% during the week, making it the strongest-performing cryptocurrency in the short term. By contrast, Ethereum has advanced approximately 2.00%, reflecting a more moderate performance. This suggests that, while overall market sentiment remains constructive, leadership is increasingly concentrated in specific assets rather than being driven by a broad-based rally.
- Looking at the last 10 weeks, the market continues to display a favorable medium-term structure. Comparing current prices with levels seen ten weeks ago still shows broad gains across the sector, confirming that the buying pressure observed in recent months remains relevant. Once again, Litecoin stands out, posting gains of approximately 64.00%, making it not only the strongest-performing cryptocurrency over the short term but also over the medium-term horizon. Overall, despite the corrective moves seen in some assets recently, the market continues to trade comfortably in positive territory over this timeframe.
- The yearly picture remains one of the main challenges for the sector. Most major cryptocurrencies continue to trade below their opening levels for 2026, highlighting that part of the weakness seen during the first months of the year still weighs on longer-term performance. Cardano remains the weakest asset, posting losses of nearly 25.00%, while Bitcoin and Litecoin are down approximately 3.72% and 3.56%, respectively. This suggests that these two assets are currently the closest to achieving a positive annual performance, while the rest of the market continues to work toward a more complete recovery.
- Bitcoin, as the market's primary benchmark, has managed to maintain relatively stable buying pressure throughout the week. The asset has recovered more than $3,000 in value and continues to trade above the important $80,000 reference level. However, the pace of the advance has begun to moderate compared with the strength observed during the previous week, a situation that could be reflecting the early stages of a more cautious market environment.
- In general, the cryptocurrency market continues to develop under a constructive backdrop supported by a bullish bias that remained limited only a few weeks ago. However, Bitcoin's recent loss of momentum is becoming increasingly important because the asset typically acts as the market's main confidence driver. If this slowdown persists, a more evident phase of indecision could begin to emerge during the short term.
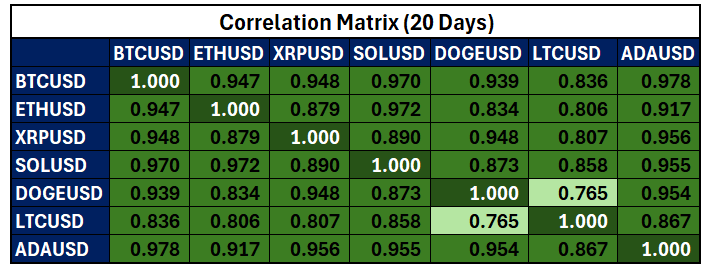
Colors from red to green. Red represents negative correlations, while green represents positive correlations.
Source: Data - StoneX, Tradingview
From a correlation perspective, the market continues to maintain a very strong relationship with Bitcoin. Correlation coefficients among the major cryptocurrencies remain above 0.8 on average over the last 20 trading sessions, highlighting the importance of BTC as the key reference for broader market behavior. Correlation coefficients may change over time.
This remains relevant because it shows that the market is still moving in a relatively synchronized manner. Unlike previous weeks, when only a few isolated assets were able to recover, price action has become more uniform across the sector. However, this synchronization also means that any deterioration in confidence surrounding Bitcoin could quickly spread to the rest of the market. As a result, unless BTC regains a stronger pattern of higher highs, the risk of a broader period of indecision is likely to remain relevant for the cryptocurrency market as a whole.
Bitcoin Continues to Highlight a Potential Uptrend
Source: StoneX, Tradingview
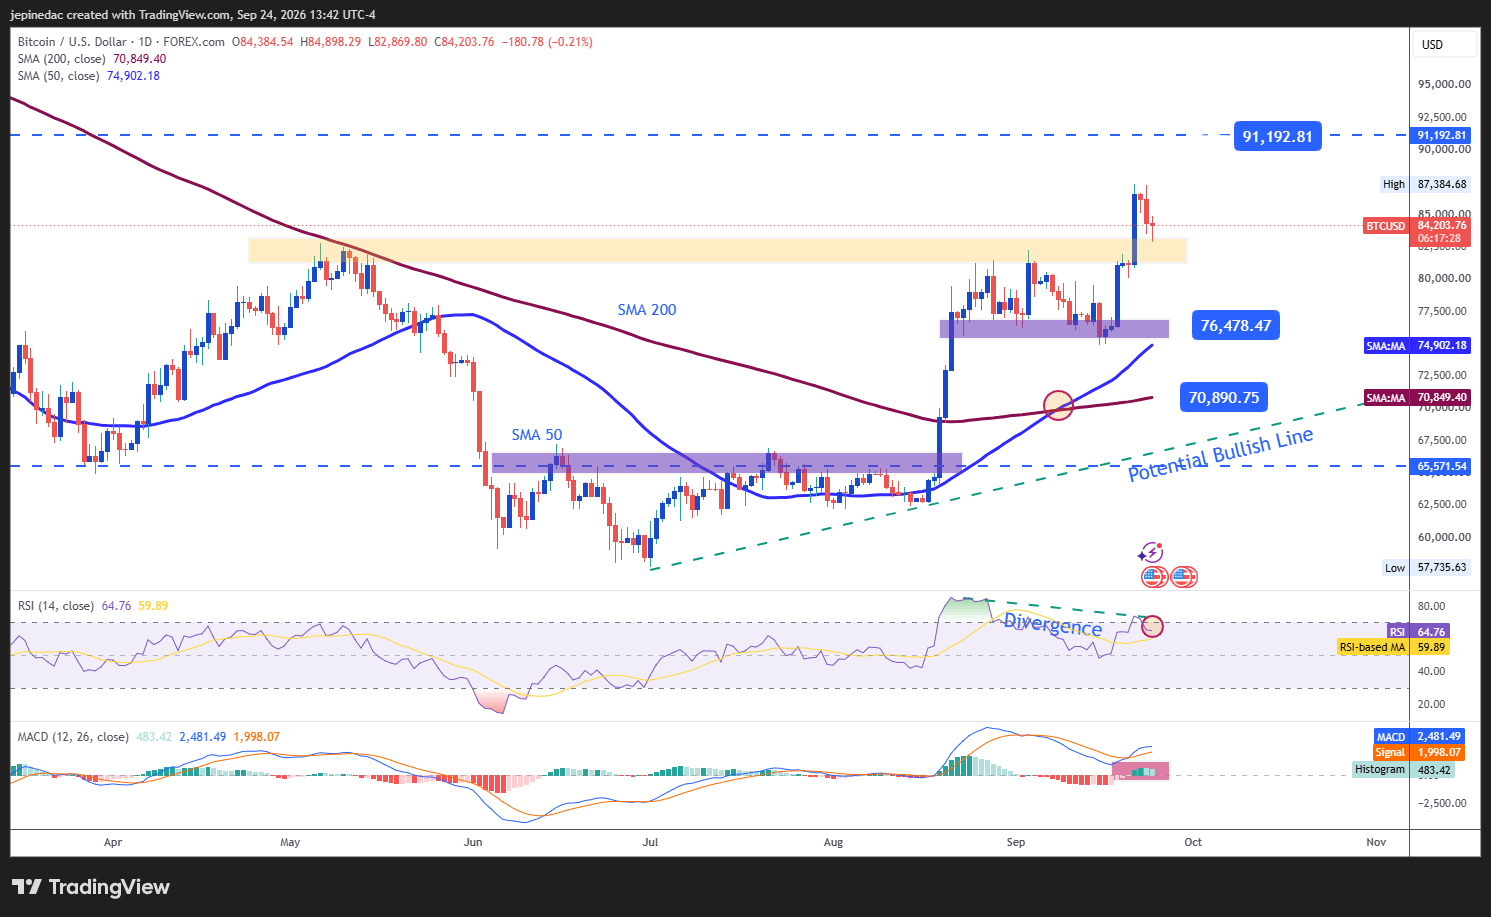
Bitcoin has managed to maintain a constructive bullish structure during recent weeks, and the cumulative price advance continues to reinforce a potential short-term uptrend line. This structure is increasingly emerging as one of the most important technical references on the chart and could gain further relevance if prices continue to develop new highs over the coming sessions. Nevertheless, recent pullbacks are also beginning to reflect a loss of momentum, a situation that could threaten the continuity of the trend if the market fails to maintain a consistent sequence of higher highs.
Indicators:
- The MACD histogram continues to trade above the 0 neutral line, indicating that the average strength of short-term moving averages remains bullish. However, a bearish divergence in the RSI is becoming increasingly relevant, with Bitcoin continuing to register higher highs while the RSI posts lower highs. This pattern is often interpreted as an early sign of buyer exhaustion and may continue to signal room for short-term corrective pullbacks.
Key Levels:
- $91,000 – Key Resistance: A major high not seen since January of this year and currently the most important upside barrier on the chart. Price action moving consistently toward this area could reinforce the bullish bias and support a further acceleration of the ongoing uptrend in the weeks ahead.
- $76,400 – Near-Term Barrier: A level that coincides with important retracement zones observed weeks ago and represents the nearest support reference within the market. This area may become the primary level to monitor in the event of short-term bearish corrections.
- $70,900 – Critical Support: A level aligned with the 50-period and 200-period simple moving averages, making it one of the most relevant support barriers within the current structure. A move back toward this area could threaten the existing uptrend and open the door to a more pronounced phase of indecision or even a broader trading range.
Litecoin Emerges as the Strongest Cryptocurrency of the Week
Source: StoneX, Tradingview
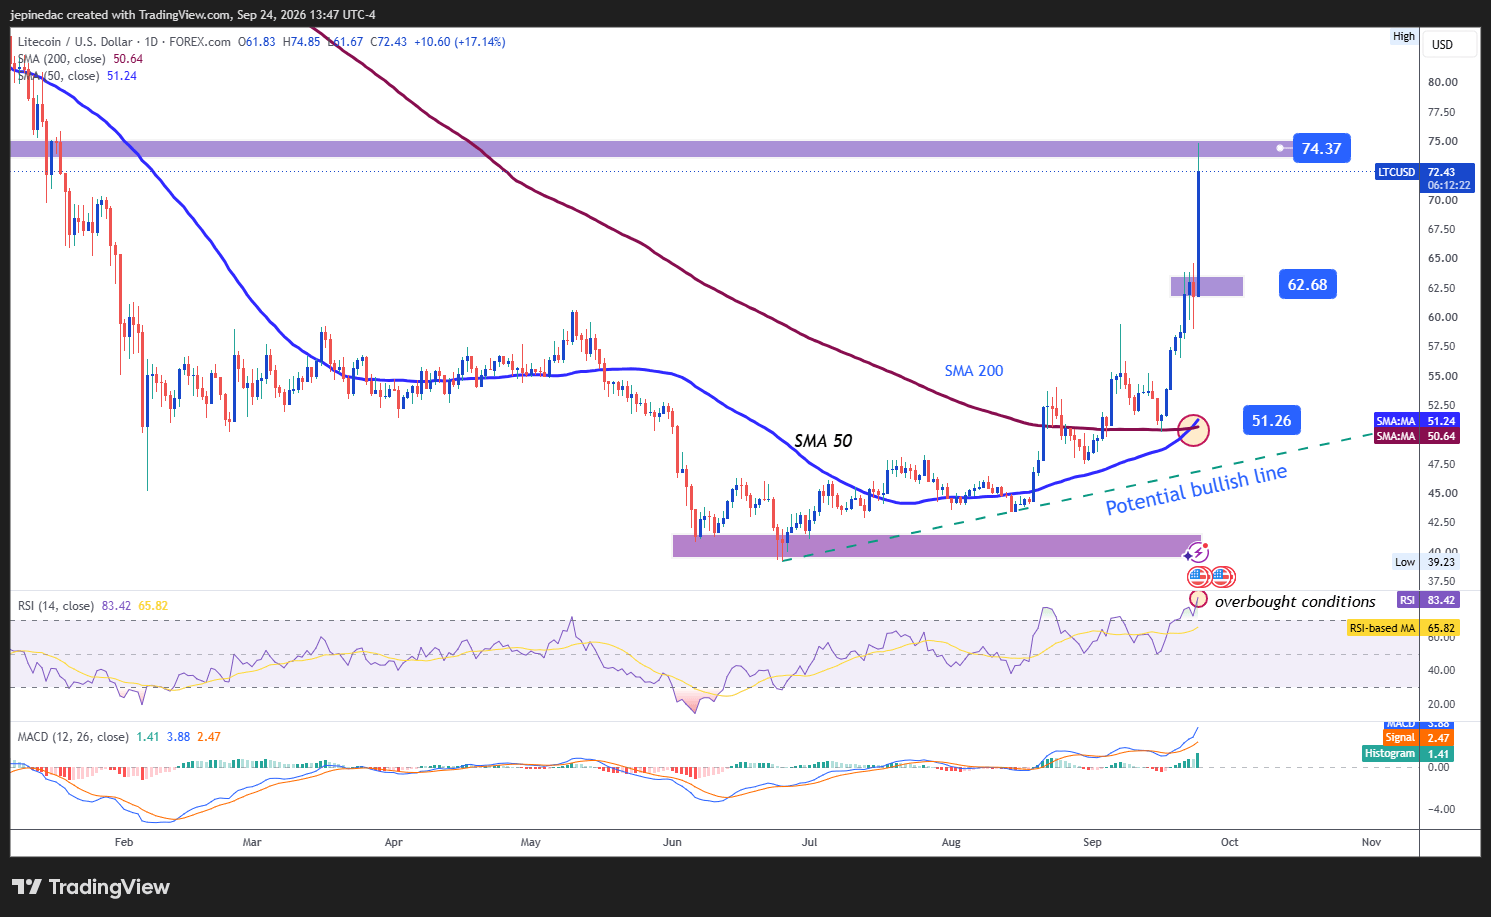
Litecoin has significantly outperformed the rest of the cryptocurrency market this week and currently stands as the strongest-performing asset in the short term. Buying pressure has accelerated considerably and has helped reinforce a potential bullish trendline that first began developing several weeks ago. However, it is also important to recognize that the speed of the move has been substantial, increasing the likelihood of short-term corrective pullbacks as the market attempts to stabilize part of the recent gains.
Indicators:
- Both the MACD and RSI continue to develop above their respective neutral levels, reflecting the dominance of buying pressure in the short term. However, the RSI is now trading well above the 70 overbought level, a situation that typically reflects excessive recent buying activity and may open the door to corrective moves during the coming sessions.
Key Levels:
- 74.37 – Key Resistance: A level not seen since January of this year and currently the most important upside barrier on the chart. Sustained price action above this reference could reinforce the dominance of the bullish bias and support the development of a more aggressive upward structure in the short term.
- 62.68 – Near-Term Barrier: A level that coincides with the closest retracement zone on the chart and could become the primary reference to monitor in the event of short-term corrective moves.
- 51.26 – Key Support: A level aligned with the 50-period and 200-period moving averages, making it the most important downside barrier on the chart. A move back toward this area could weaken the credibility of the recent recovery and open the door to a more meaningful phase of indecision during the coming sessions.
Written by Julian Pineda, CFA, CMT – Market Analyst
Follow him on: @julianpineda25




Open an account in minutes
Experience award-winning platforms with fast and secure execution.
Economic calendar
Web Trader platform
Our sophisticated web-based platform is packed with features.
Related articles

Bitcoin Analysis: BTC Weakness Deepens as Price Approaches $70K
These continue to be challenging sessions for Bitcoin in the short term. The cryptocurrency keeps losing ground consistently and has declined nearly 2.7% over the last three trading sessions, highlighting a phase of weakness that is becoming increasingly relevant within the market.

Bitcoin forecast: five weeks of selling put $65,000 back in focus
Bitcoin has fallen for five straight weeks, and a hotter October CPI report has added to the pressure. Record ETF outflows, forced liquidations and rising rate-hike bets leave $65,000 back in focus.


Crude Oil Weekly Outlook: Houthi Attacks vs. a Double Top?
Crude oil weekly outlook: The Democratic win triggered a steep sell-off across crude oil charts, pushing WTI toward the neckline of a potential major double-top pattern. However, the new Congress does not take office until January, while persistent geopolitical risks—including the latest Houthi escalations—continue to keep a risk premium embedded in oil prices.
The information on this web site is not targeted at the general public of any particular country. It is not intended for distribution to residents in any country where such distribution or use would contravene any local law or regulatory requirement. The information and opinions in this report are for general information use only and are not intended as an offer or solicitation with respect to the purchase or sale of any currency or CFD contract. All opinions and information contained in this report are subject to change without notice. This report has been prepared without regard to the specific investment objectives, financial situation and needs of any particular recipient. Any references to historical price movements or levels is informational based on our analysis and we do not represent or warranty that any such movements or levels are likely to reoccur in the future. While the information contained herein was obtained from sources believed to be reliable, author does not guarantee its accuracy or completeness, nor does author assume any liability for any direct, indirect or consequential loss that may result from the reliance by any person upon any such information or opinions.
Futures, Options on Futures, Foreign Exchange and other leveraged products involves significant risk of loss and is not suitable for all investors. Losses can exceed your deposits. Increasing leverage increases risk. Spot Gold and Silver contracts are not subject to regulation under the U.S. Commodity Exchange Act. Contracts for Difference (CFDs) are not available for US residents. Before deciding to trade forex, commodity futures, or digital assets, you should carefully consider your financial objectives, level of experience and risk appetite. Any opinions, news, research, analyses, prices or other information contained herein is intended as general information about the subject matter covered and is provided with the understanding that we do not provide any investment, legal, or tax advice. You should consult with appropriate counsel or other advisors on all investment, legal, or tax matters. References to FOREX.com or GAIN Capital refer to StoneX Group Inc. and its subsidiaries. Please read Characteristics and Risks of Standardized Options.