- Gold, silver retreat as sellers return
- 4H charts show building downside pressure
- Macro narrative struggles to explain the move
- US payrolls could deliver fresh volatility in both metals
Questioning the macro explanation
Gold and silver reversed sharply on Thursday, with the usual narrative quickly emerging that rising US Treasury yields and a stronger dollar were to blame. Perhaps. But that explanation feels a bit like sticking a finger in the wind and hoping. When I checked the correlations over the past week, there was no meaningful relationship to speak of. The same was true for energy futures and volatility measures.
Another explanation may be far simpler: profit taking. Even after the mammoth unwind seen in late January, plenty of traders and investors are still sitting on large unrealised gains in the metals complex. If losses were building elsewhere during the session, trimming positions in gold and silver to free up capital would hardly be surprising. And, let's be honest, neither metal has behaved like a pure-play safe haven recently. Price action has often resembled that of high-beta risk assets, with swings that at times make bitcoin volatility look tame.
What does stand out when narrowing down to shorter timeframes is that traders appear to be taking their cues from the charts rather than entering positions blindly. Prices continue to respect levels carved out previously. It may be an incredibly difficult environment to assess directional risks given the torrent of contradictory headlines hitting markets daily, but those technical levels at least provide traders with something tangible to work with when price moves or tests known zones.
Silver sellers in the ascendancy
Source: TradingView
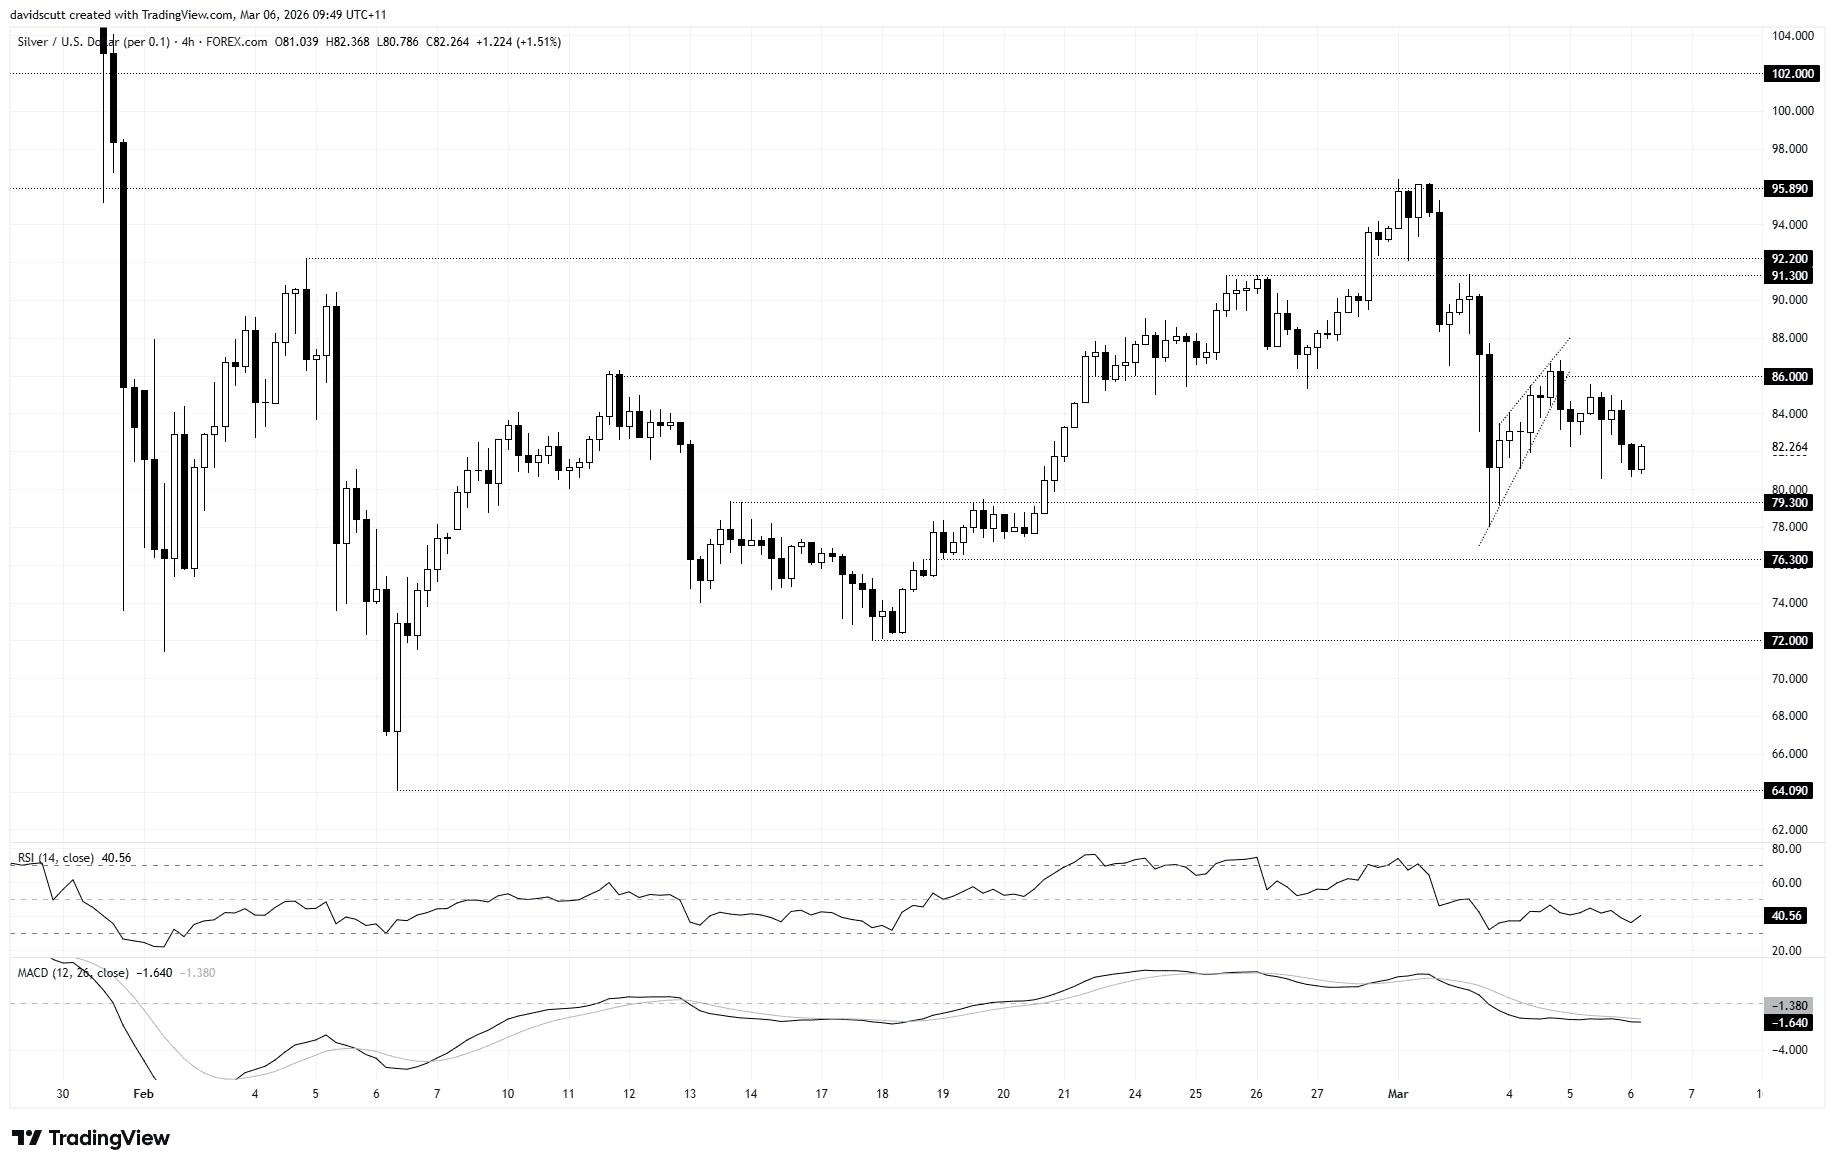
Silver has drifted lower on the 4-hour timeframe recently, carving out a series of lower highs that point to building downside pressure. Momentum signals broadly align with that view. RSI (14) continues to trend lower beneath 50 while MACD has crossed below the signal line and remains in negative territory. Neither signal screams that bears are fully in control, but they do suggest sellers are in the ascendancy for now, favouring a strategy of selling into strength.
That bias may remain in place unless the price can reclaim $86. The metal stalled briefly around that level earlier this week before a key reversal candle formed, kicking off the steady dribble lower seen in recent days. A move back above would lessen immediate downside risks and could shift the near-term bias.
On the downside, bids have emerged on approach to $80 over the past day, but $79.30 appears the more important level to watch. It marks the point where a decent bullish breakout occurred in late February and has already been tested from above on a couple of occasions this month. While one move managed to push below briefly, it failed to hold, with the price rebounding immediately afterwards.
The low from that failed break sits at $78, placing it on the radar should another downside flush occur. Beneath that, $76.30 stands out as a minor level of interest before attention turns to the February 18 swing lows near $72.
Above the current price, $86 remains a notable resistance zone, having acted as both support and resistance at various points this year. A break of that level would weaken the bearish near-term setup and could open the door for a move back towards the next notable resistance band between $91.30 and $92.20.
Gold bears defend $5200

Source: TradingView
Like silver, gold looks heavy on the 4-hour timeframe after running into plenty of willing sellers at $5200 earlier this week. With RSI (14) sitting beneath 50 and MACD in negative territory after crossing below the signal line, the signals point to bears holding the near-term advantage.
$5120 is a level worth watching overhead given the price had found buying beneath it earlier this week prior to the unwind seen on Thursday. That could be an area of interest for those looking to play gold from the short side, allowing stops to be placed above should we see a retest and failure at the level on Friday.
Levels to watch below include $5000 where the early-week flush stalled on Tuesday, with $4965 the next level of note having acted as both support and resistance previously. $4850 is another level to keep on the radar, with a break of that swing low opening the door for a larger downside flush.
Aside from $5120, $5200 should also remain on the watchlist given it capped gains earlier this week. A sustained break above it would tilt directional risk higher, boosting the probability of a retest of the late-January high at $5420.
Payrolls to test macro narrative
Looking ahead, the US nonfarm payrolls report later tonight looms as a known volatility event that could present fresh trade setups in both metals. The prevailing macro narrative suggests a softer report may boost gold and silver on the prospect of a weaker dollar and lower Treasury yields. But it could just as easily spark renewed weakness in risk assets, particularly after resilient data earlier in the week helped underpin US stocks. That would test the narrative, as would a strong report given it may fuel further upside in the dollar and yields.
In reality, while payrolls is always an important market driver, it’s the geopolitical headlines traders will likely be assessing into the weekend, not backward-looking labour market data.