The catalyst event for the rally in gold was notable, as it was a comment from Austan Goolsbee in February of 2024 that showed that the Fed was looking to cut rates even though inflation remained high. At the time, gold was still working to confirm it’s rally above the $2k level, and there were two days in 2024 where spot gold actually closed below that line in the sand. Those were both after the US CPI release in February of that year, when there was building question as to whether the Fed would actually be able to cut rates later that year.
But it was during a television interview that a widely-watched Fed member seemingly dismissed that inflation. And, instead, he highlighted that markets should avoid getting ‘flipped out’ about one single data point when in reality inflation had remained above the Fed’s target for months. But – gold saw through that, a day later it closed above $2k again and it never looked back, going into a parabolic rally that only seemed to grow more and more parabolic.
To be sure there have been some pauses along the way. There have been three clean bull pennant formations and each has led into breakout and continuation. But what stands out about this week is just how aggressive sellers were as prices dropped from the $5k handle on Fed day to the $4500 level into the weekly close.
Gold Weekly Chart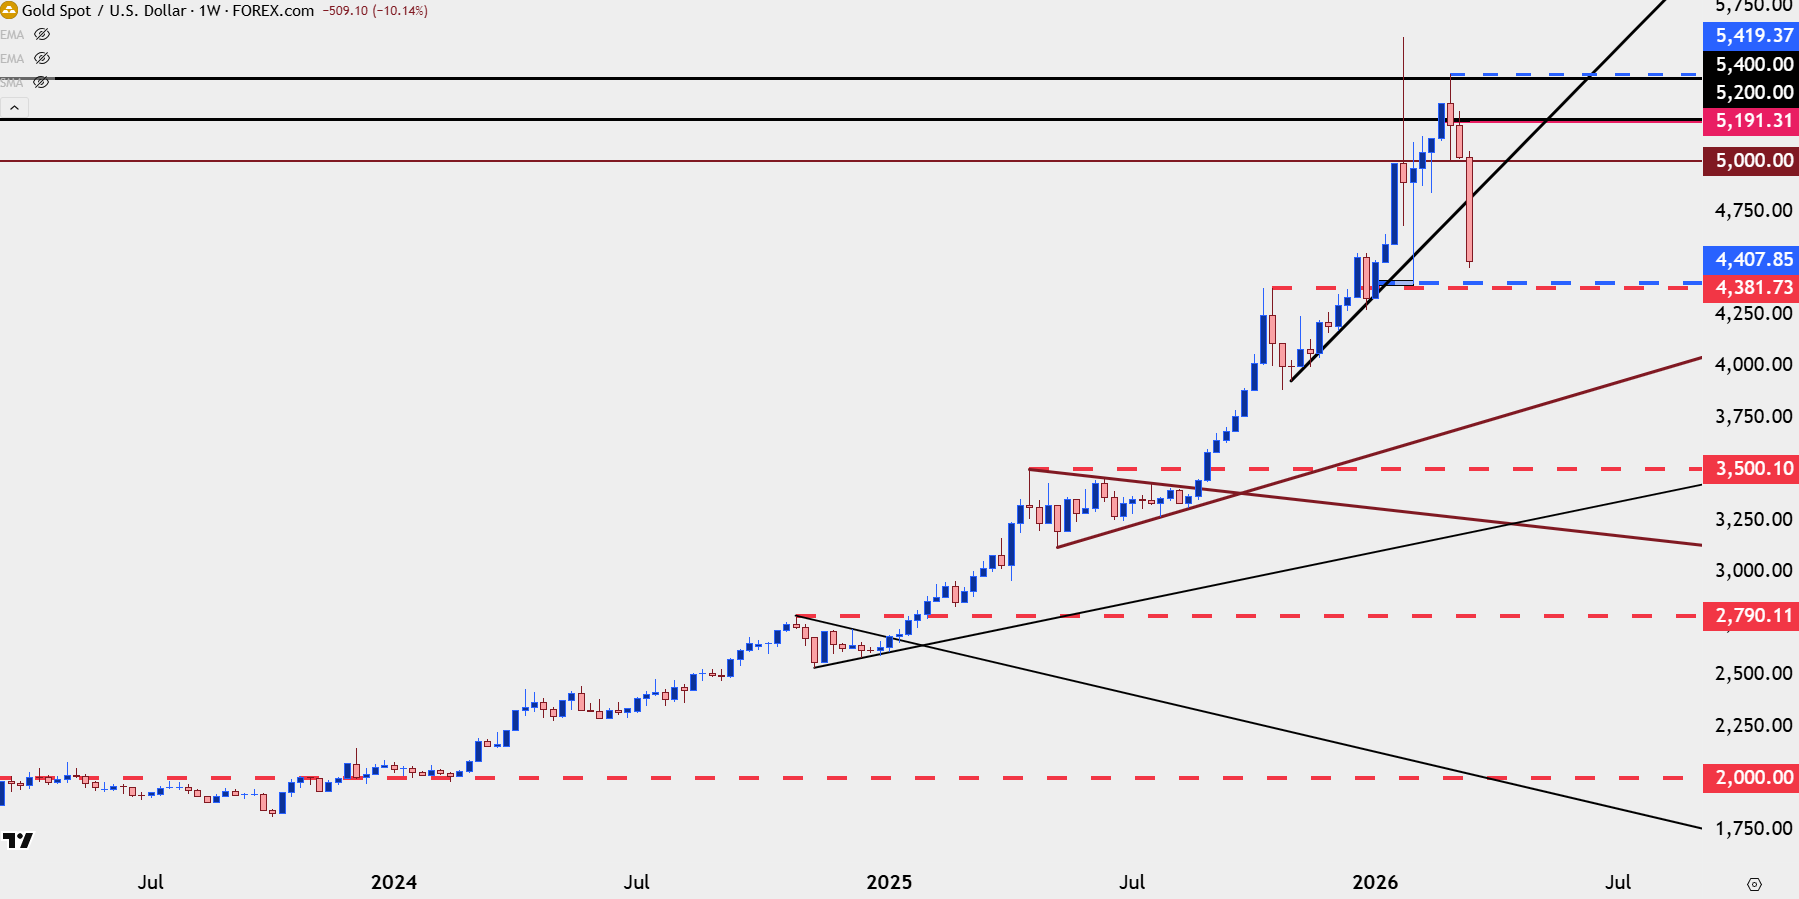
Chart prepared by James Stanley; data derived from Tradingview
Gold Post-Fed
The highlight from the Federal Reserve meeting was a Jerome Powell that didn’t sound as dovish as usual, and he even had the comment during the press conference that there was even conversation at the Fed whether the next move would be a hike as opposed to a cut. That, combined with strength in oil prices which often has a flow-through effect on inflation, was enough to unnerve investors that inflation may be growing to the point where central banks need to hike rates.
A central bank hiking rates in the face of inflation is the opposite of what was happening back in February of 2024, when the Fed was talking up rate cuts even when inflation was elevated and above target.
As we came into the Wednesday Fed meeting gold was holding the $5k level on the chart, but it put in a clear breakdown in the three days after with a more than 10% move. The next level down is a spot of resistance-turned-support around the $4400 level which hasn’t been in-play since February.
Gold Daily Chart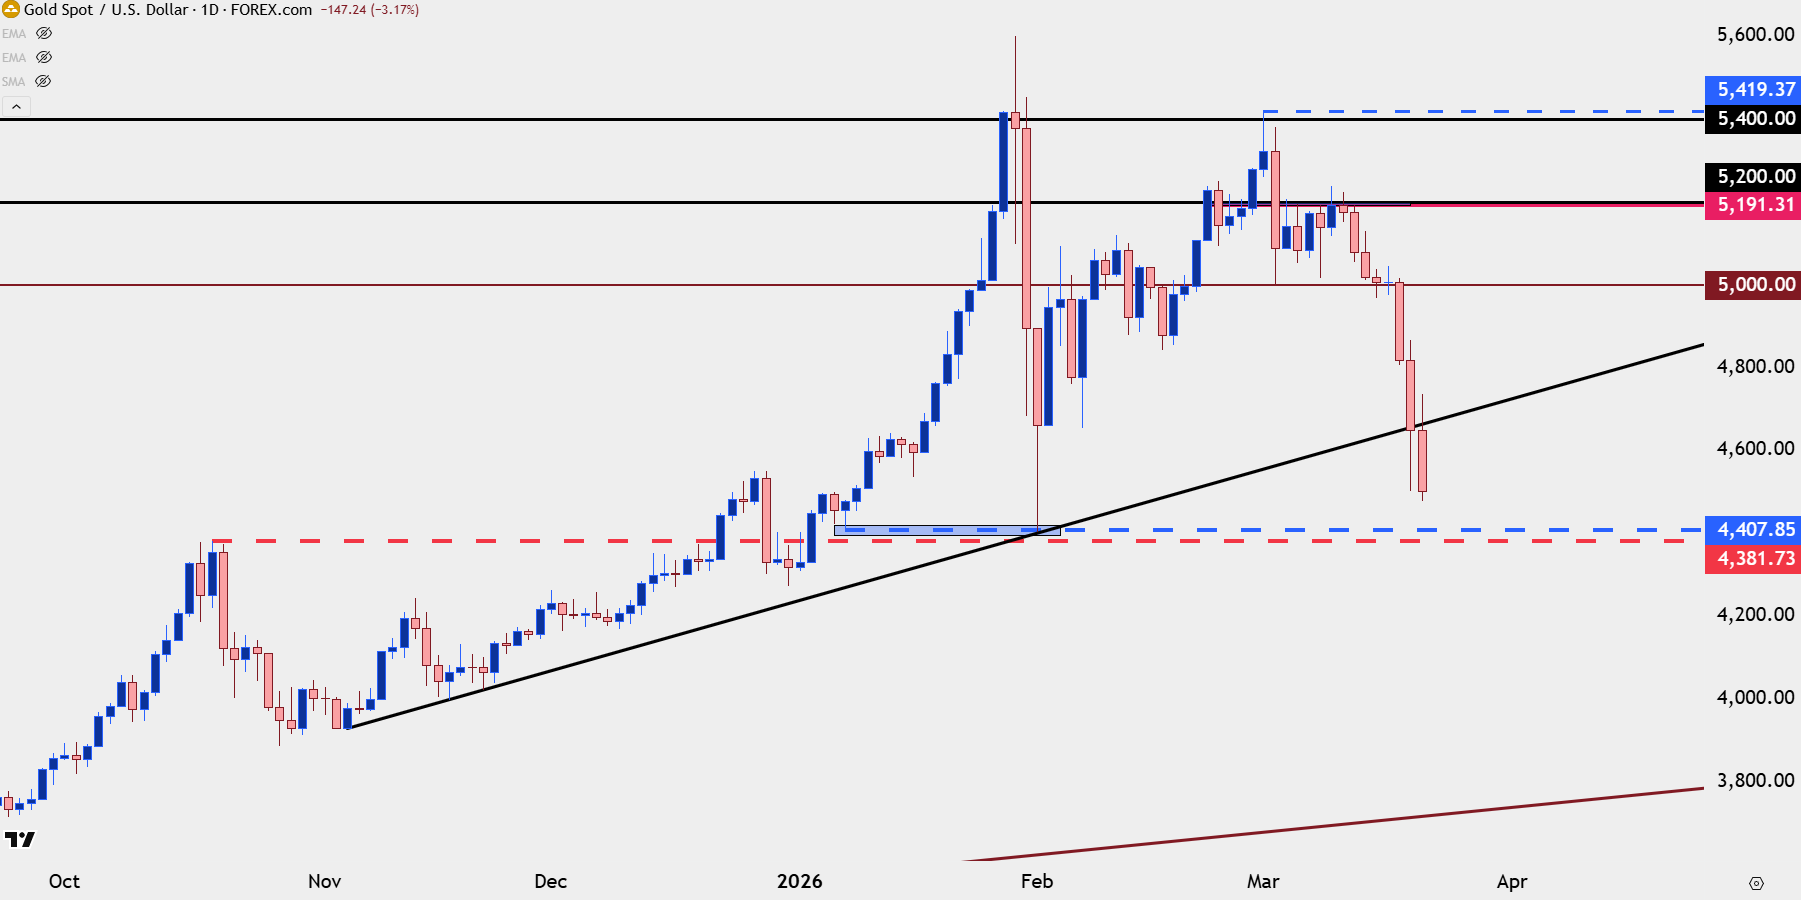
Chart prepared by James Stanley; data derived from Tradingview
Gold Momentum
Form the four-hour chart the sequencing of lower-lows and highs is clear, and this is the tide that buyers will need to break if they do want to wrestle back control. The 4700 level was notable on Friday morning as this held the initial bounce from 4500, but sellers simply stretched down for a re-test in the close and this exhibits bearish control.
A bit lower is that swing low from early-February and that’s now the next spot down; but if we are to see buyers stepping in, we’re going to need to see a higher-high to illustrate that shift back into bullish posture. At this point it’s too early to make that call given this bearish sequence on the four-hour chart.
Gold Four-Hour Chart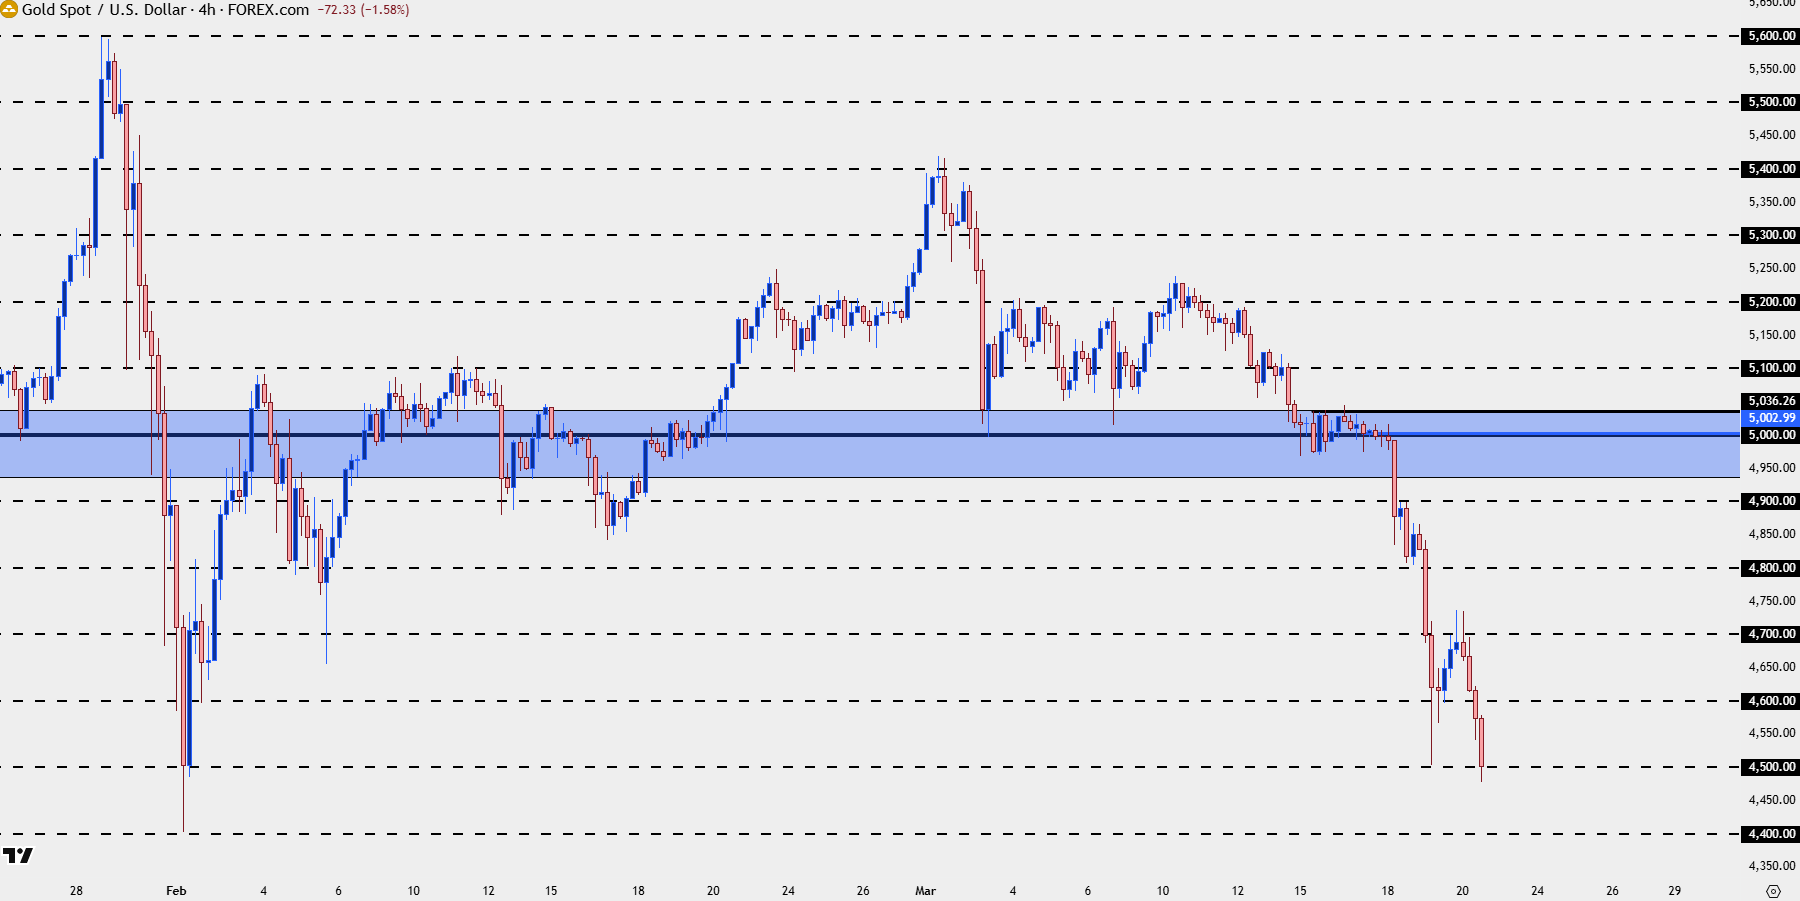
Chart prepared by James Stanley; data derived from Tradingview
--- written by James Stanley, Senior Market Analyst, Global Macro