



Nasdaq’s Uptrend Faces a Test as Silver Falters Below Historic Resistance
Tariff tensions between the US and China are capping gains in US indices as they cool off from overheated momentum levels, while gold and silver continue to stretch toward historical momentum extremes.
Share this:

Key Events
- Silver pulls back below its 45-year resistance.
- Nasdaq recovers on positive earnings and dovish Powell comments, though a full recovery remains in question.
- Tariff headlines and the ongoing US government shutdown continue to threaten market risk appetite.
Tariff tensions between the US and China have helped US indices ease their overheated momentum, while gold and silver approach stretched historical levels. Risk appetite seems to have hit resistance following upbeat US bank earnings from JPMorgan and Wells Fargo, alongside Powell’s dovish tone. Yet, uncertainty surrounding trade negotiations and the government shutdown keeps the full recovery in question.
Will tariff tensions trigger another downturn, or will progress on trade allow US indices to reclaim record highs — giving precious metals a chance to consolidate before resuming their broader uptrends?
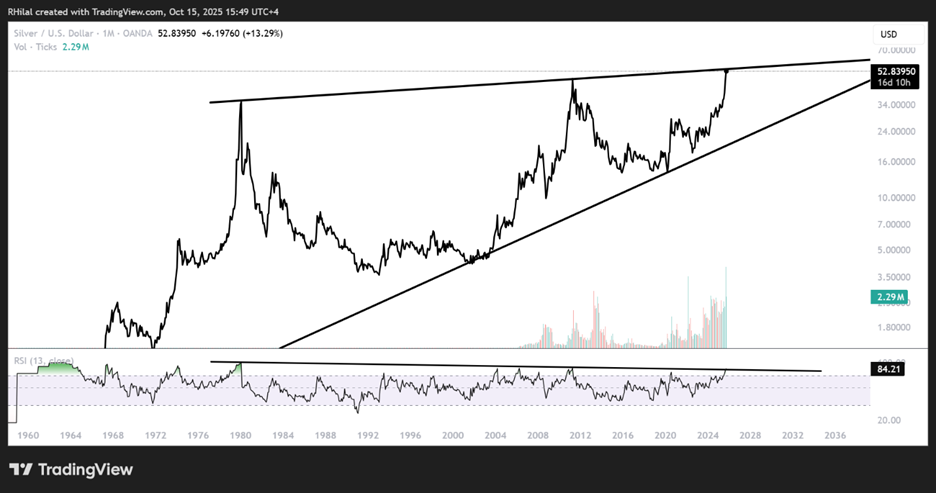
Silver Outlook: Monthly Time Frame – Log Scale
Source: Tradingview
Silver’s line chart has aligned with a 45-year resistance trendline stretching back to the 1980s, raising downside questions for the ongoing rally. With gold trading near $4,200 and silver pulling back from $53.60 toward the $51 level, the metal’s strength appears to be waning.
This setup may reflect broader shifts in market sentiment as investors balance Powell’s dovish tone with uncertainty around US–China trade negotiations.
Silver Outlook: Weekly Time Frame – Log Scale

Source: Tradingview
On the weekly chart, silver is eyeing the upper boundary of a duplicated uptrend channel respected since 2023, right near its 45-year resistance line. The lower channel boundaries could support any pullback around $47 and $44, aligning with the trendline connecting higher highs from 2023–2024.
On the upside, if silver holds above $53.60 and breaks through the long-term resistance from 1980, the rally could extend toward the channel’s upper border near the $56.50–$57.00 zone, before tracing a proper pullback to recharge the heated momentum.
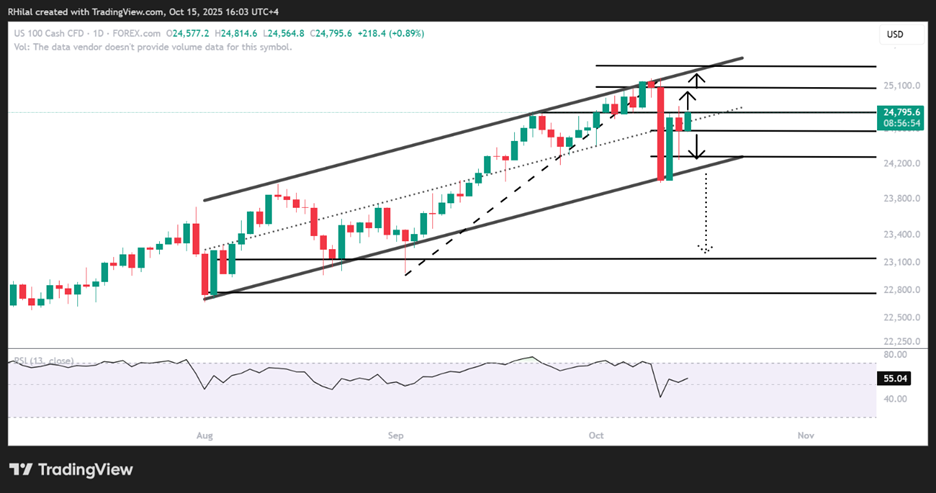
Nasdaq Outlook: Daily Time Frame – Log Scale
Source: Tradingview
The Nasdaq has successfully rebounded from the 24,000 support level — the lower boundary of its parallel ascending channel since August — and is now testing resistance near 24,800. A confirmed breakout above this zone could pave the way for further gains toward the 25,000–25,300 region.
However, a drop back below 24,500 may reopen downside risk toward 24,300 and 24,000. A sustained move below 23,900 could accelerate losses by another 1,000 points, targeting 23,100–22,900 respectively, mimicking the emotional sell off of April 2025.
Written by Razan Hilal, CMT
Follow on X: @Rh_waves
Related tags:


Open an account in minutes
Experience award-winning platforms with fast and secure execution.
Economic calendar
Web Trader platform
Our sophisticated web-based platform is packed with features.
Related articles

S&P 500, Nasdaq 100 Claw Back But NVDA Cloud Looms Overhead
Last week was green for both the Nasdaq and S&P 500 but given the sell-off that led into that bounce there’s still a very real question as to whether bears still have a statement to make. And the NVDA situation presents a very real threat.


Gold outlook: seasonal tailwind offers hope with XAU/USD below $4,000
A historically stronger seasonal window and steady central bank buying are offering gold some hope after its slide to a fresh 2026 low. Reclaiming the 4,000 mark is the first sign that the metal may have found a floor.


Nasdaq 100 Forecast: Nvidia CEO Huang is Out – What’s Next for NDX?
While the issue is as idiosyncratic as it gets, Nvidia’s turmoil may nonetheless have broader market implications for the Nasdaq 100 and AI trade as a whole.

The information on this web site is not targeted at the general public of any particular country. It is not intended for distribution to residents in any country where such distribution or use would contravene any local law or regulatory requirement. The information and opinions in this report are for general information use only and are not intended as an offer or solicitation with respect to the purchase or sale of any currency or CFD contract. All opinions and information contained in this report are subject to change without notice. This report has been prepared without regard to the specific investment objectives, financial situation and needs of any particular recipient. Any references to historical price movements or levels is informational based on our analysis and we do not represent or warranty that any such movements or levels are likely to reoccur in the future. While the information contained herein was obtained from sources believed to be reliable, author does not guarantee its accuracy or completeness, nor does author assume any liability for any direct, indirect or consequential loss that may result from the reliance by any person upon any such information or opinions.
Futures, Options on Futures, Foreign Exchange and other leveraged products involves significant risk of loss and is not suitable for all investors. Losses can exceed your deposits. Increasing leverage increases risk. Spot Gold and Silver contracts are not subject to regulation under the U.S. Commodity Exchange Act. Contracts for Difference (CFDs) are not available for US residents. Before deciding to trade forex, commodity futures, or digital assets, you should carefully consider your financial objectives, level of experience and risk appetite. Any opinions, news, research, analyses, prices or other information contained herein is intended as general information about the subject matter covered and is provided with the understanding that we do not provide any investment, legal, or tax advice. You should consult with appropriate counsel or other advisors on all investment, legal, or tax matters. References to FOREX.com or GAIN Capital refer to StoneX Group Inc. and its subsidiaries. Please read Characteristics and Risks of Standardized Options.