



NZDJPY Collapses as NZ Business Confidence Hits Lowest Level in a Decade
What is a trend? There are countless ways to answer that question, but I’ve always been partial to perhaps the simplest definition: an uptrend is when an asset moves from the lower left to the upper right corner of the chart, and a downtrend is when it moves from the upper left to the lower right corner.
Share this:

What is a trend?
There are countless ways to answer that question, but I’ve always been partial to perhaps the simplest definition: an uptrend is when an asset moves from the lower left to the upper right corner of the chart, and a downtrend is when it moves from the upper left to the lower right corner.
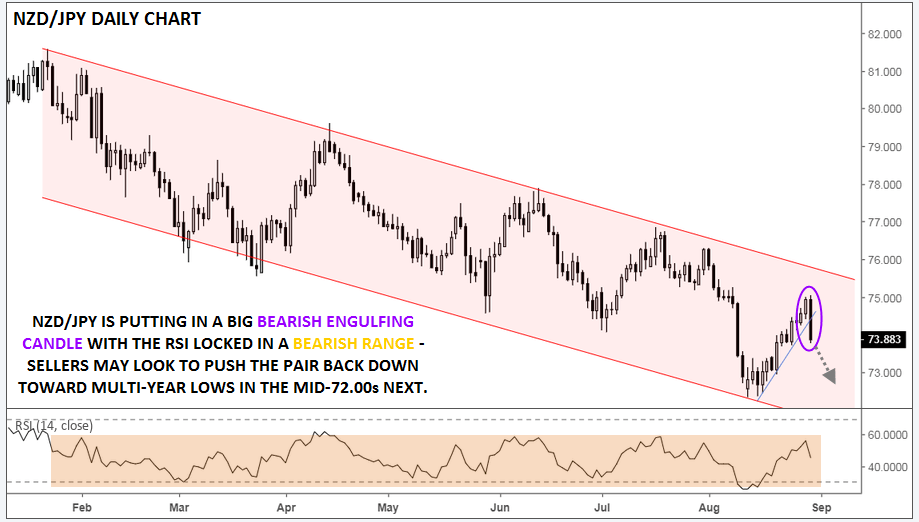
By that definition, NZD/JPY has undoubtedly been a in a downtrend through this year. The cross reached a peak around 81.50 back in late January and has been consistently grinding lower since then, shedding over 900 pips by the middle of this month. Rates have spent the last two weeks rallying off the lows, but the data released in today’s Asian session led to a violent reversal back in the direction of the dominant downtrend.
Overnight, the ANZ Business Confidence survey for August printed at -50.3, its lowest reading. Measures like this, while occasionally noisy, provide a leading indicator of economic health given businesses’ sensitivity to minute changes in underlying business conditions. The survey has now shown business confidence falling for six consecutive months; combined with the continued decline in Global Dairy Trade auction prices, there’s plenty for NZD bulls (and the RBNZ!) to worry about.
Turning our attention back to the chart, NZD/JPY has sliced through its corrective trend line, forming a big bearish engulfing candle in the process. This price action shows a dramatic shift to near-term selling pressure and suggests that the longer-term downtrend has resumed. Meanwhile, the RSI has been locked in a bearish range between 30 and 60 for the last seven months.
Moving forward, bears may look to push the pair the unit back toward the mid-month lows in the mid-72.00s, which also represents longer-term lows from back in 2015 and 2016.
Source: TradingView, FOREX.com
Related tags:



Open an account in minutes
Experience award-winning platforms with fast and secure execution.
Economic calendar
Web Trader platform
Our sophisticated web-based platform is packed with features.
Related articles
Gold coils for potential breakout as US CPI looms
Gold's ascending triangle is putting $4,140 firmly in focus ahead of US CPI. With traditional macro relationships offering few clues, the price action may prove more useful for traders.

USD/CAD Outlook: Loonie left behind as US CPI looms
USD/CAD's sharp rebound has coincided with widening US–Canada interest rate differentials. With US CPI approaching and bullish momentum building, another breakout may be on the cards.

USD Majors, Gold, Bitcoin, Equity Indices Weekly Technical Outlook 11 9 2026
Sr. Technical Strategist Michael Boutros highlights the levels that matter on the USD Majors, commodities, and equity indices charts this week.

The information on this web site is not targeted at the general public of any particular country. It is not intended for distribution to residents in any country where such distribution or use would contravene any local law or regulatory requirement. The information and opinions in this report are for general information use only and are not intended as an offer or solicitation with respect to the purchase or sale of any currency or CFD contract. All opinions and information contained in this report are subject to change without notice. This report has been prepared without regard to the specific investment objectives, financial situation and needs of any particular recipient. Any references to historical price movements or levels is informational based on our analysis and we do not represent or warranty that any such movements or levels are likely to reoccur in the future. While the information contained herein was obtained from sources believed to be reliable, author does not guarantee its accuracy or completeness, nor does author assume any liability for any direct, indirect or consequential loss that may result from the reliance by any person upon any such information or opinions.
Futures, Options on Futures, Foreign Exchange and other leveraged products involves significant risk of loss and is not suitable for all investors. Losses can exceed your deposits. Increasing leverage increases risk. Spot Gold and Silver contracts are not subject to regulation under the U.S. Commodity Exchange Act. Contracts for Difference (CFDs) are not available for US residents. Before deciding to trade forex, commodity futures, or digital assets, you should carefully consider your financial objectives, level of experience and risk appetite. Any opinions, news, research, analyses, prices or other information contained herein is intended as general information about the subject matter covered and is provided with the understanding that we do not provide any investment, legal, or tax advice. You should consult with appropriate counsel or other advisors on all investment, legal, or tax matters. References to FOREX.com or GAIN Capital refer to StoneX Group Inc. and its subsidiaries. Please read Characteristics and Risks of Standardized Options.