


Oil, Stocks Still Driving FX Markets as Ceasefire Hopes Push into EOW
Oil prices are still strong yet the continued rally in US equities highlights hopes that the worst of the Iran conflict is in the rear view. Tomorrow’s US CPI report is meaningful as this is expected to show the initial impact of higher energy prices.
Share this:

Stocks have put in sizable rallies over the past two weeks with the Nasdaq 100 jumping by as much as 10%. I had previously talked about how the conflict in Iran presented opportunity for bulls to pick up premium equity names, like NVDA, after a pullback. So far, the NVDA pullback has spanned only 23.6% from last year’s high to last week’s low. In the broader tech index of the Nasdaq 100, price found support around 23k last week and has since jumped by as much as 10%.
And even right now, as questions abound about whether the ceasefire will actually hold (or if there even is one as Iran has accused the US of multiple violations already), Nasdaq 100 futures remain strong as they’ve been holding support at the 25k level.
This is seemingly at odds with oil prices, which have rallied after the initial pullback driven by the ceasefire announcement.
It seems that Iran might want to impose some leverage ahead of the weekend, as they’ve been using markets to try to pressure President Trump. So if we do see tensions heat up into the weekend, and if stocks do pullback, that can be seen as opportunistic for longs to try to position in after a pullback.
Nasdaq 100 Four-Hour Chart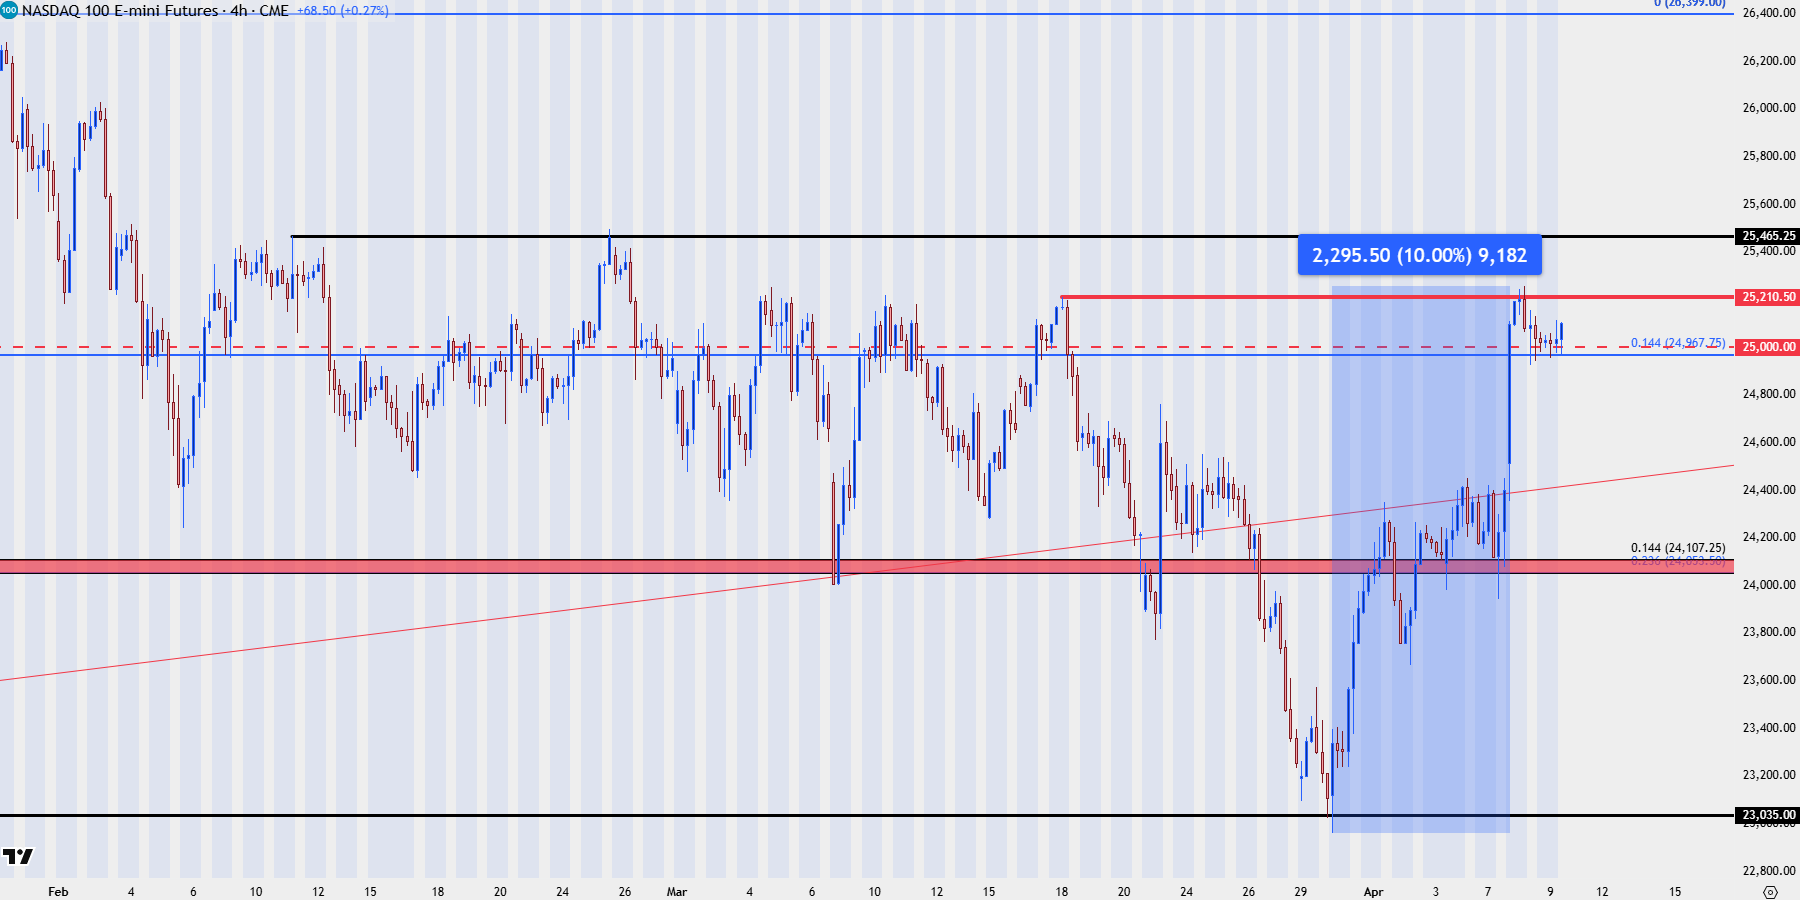
Chart prepared by James Stanley; data derived from Tradingview
Oil
While stocks show hope and optimism, oil prices show the other side.
The pullback around the ceasefire announcement was intense. The reaction since, however, has been diverging from equities that have continued the ceasefire-fueled move, and in WTI, there’s been a push back above the $100 level.
WTI Crude Oil Hourly Chart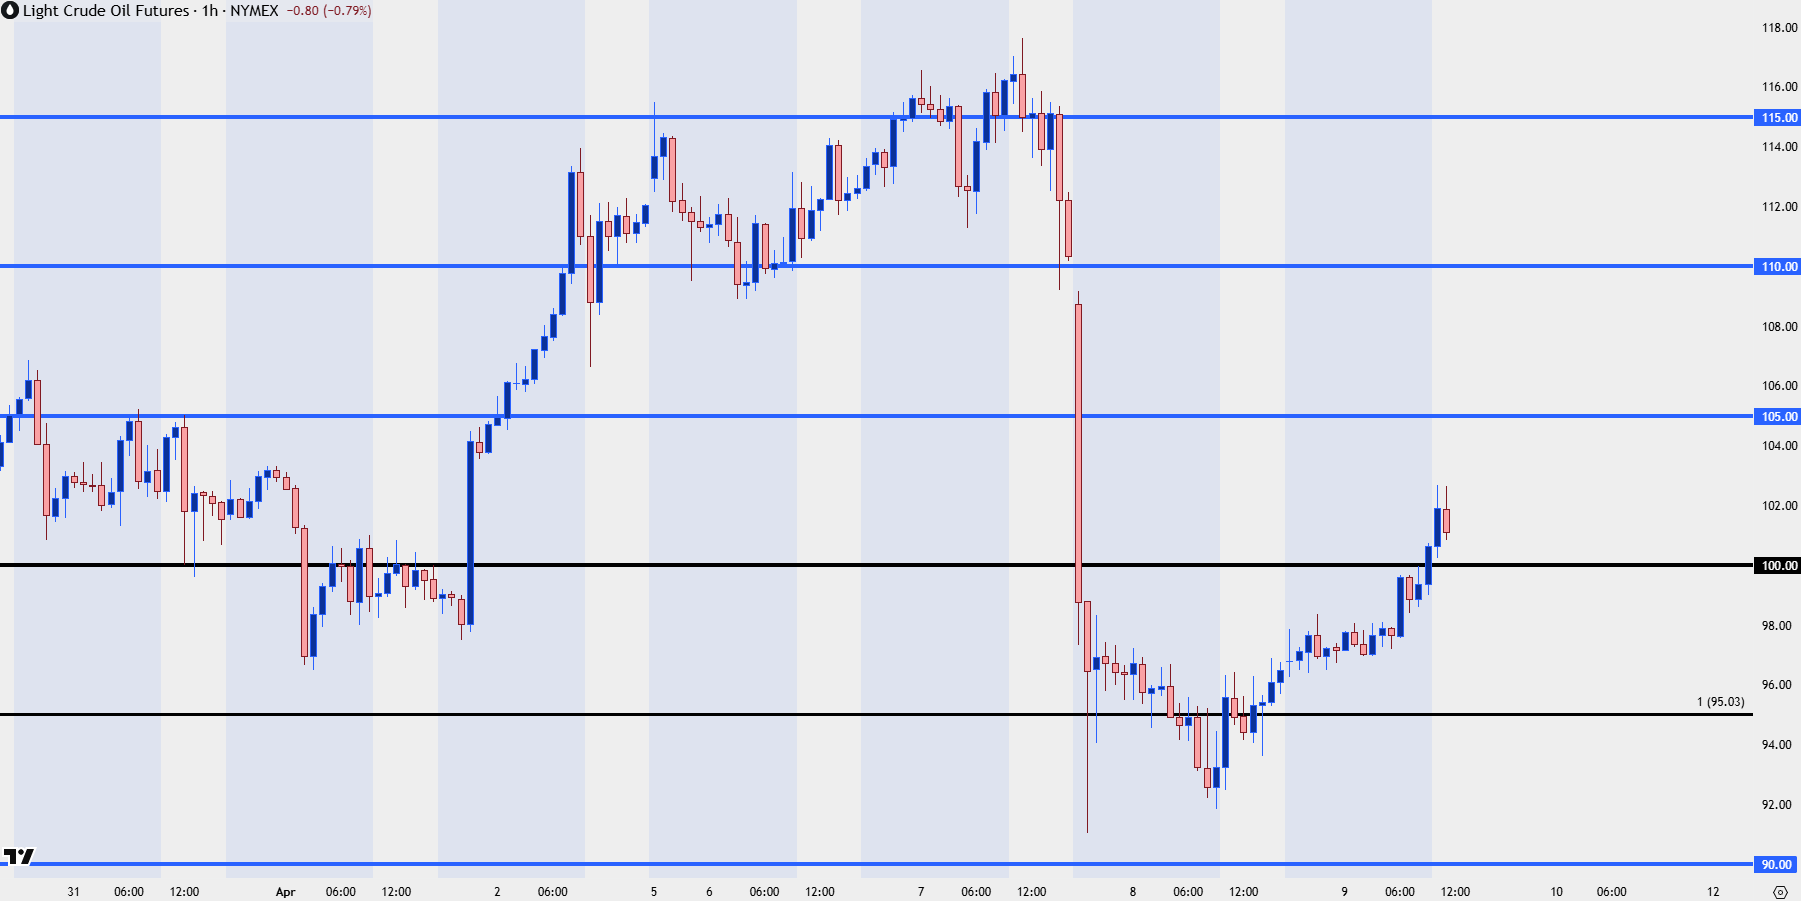
Chart prepared by James Stanley; data derived from Tradingview
USD
Going along with that rally in stocks and the pullback in oil prices we had a pullback in the US Dollar, fueled by rallies in EUR/USD and GBP/USD.
USD/JPY remains a pressure point particularly for USD-strength scenarios, as the ongoing conflict in the Middle East can make it more difficult for the Bank of Japan to defend the Yen in 160 breakout scenarios, and in that backdrop, we might see something similar to 2022 when the BoJ simply draws that line-in-the-sand further back to a 161.95 or perhaps a 165.00.
For now, USD has held the 200-day moving average and bounced mildly over the past day. If this bounce does continue, there’s lower-high resistance context at prior support, around 99.50.
US Dollar Daily Chart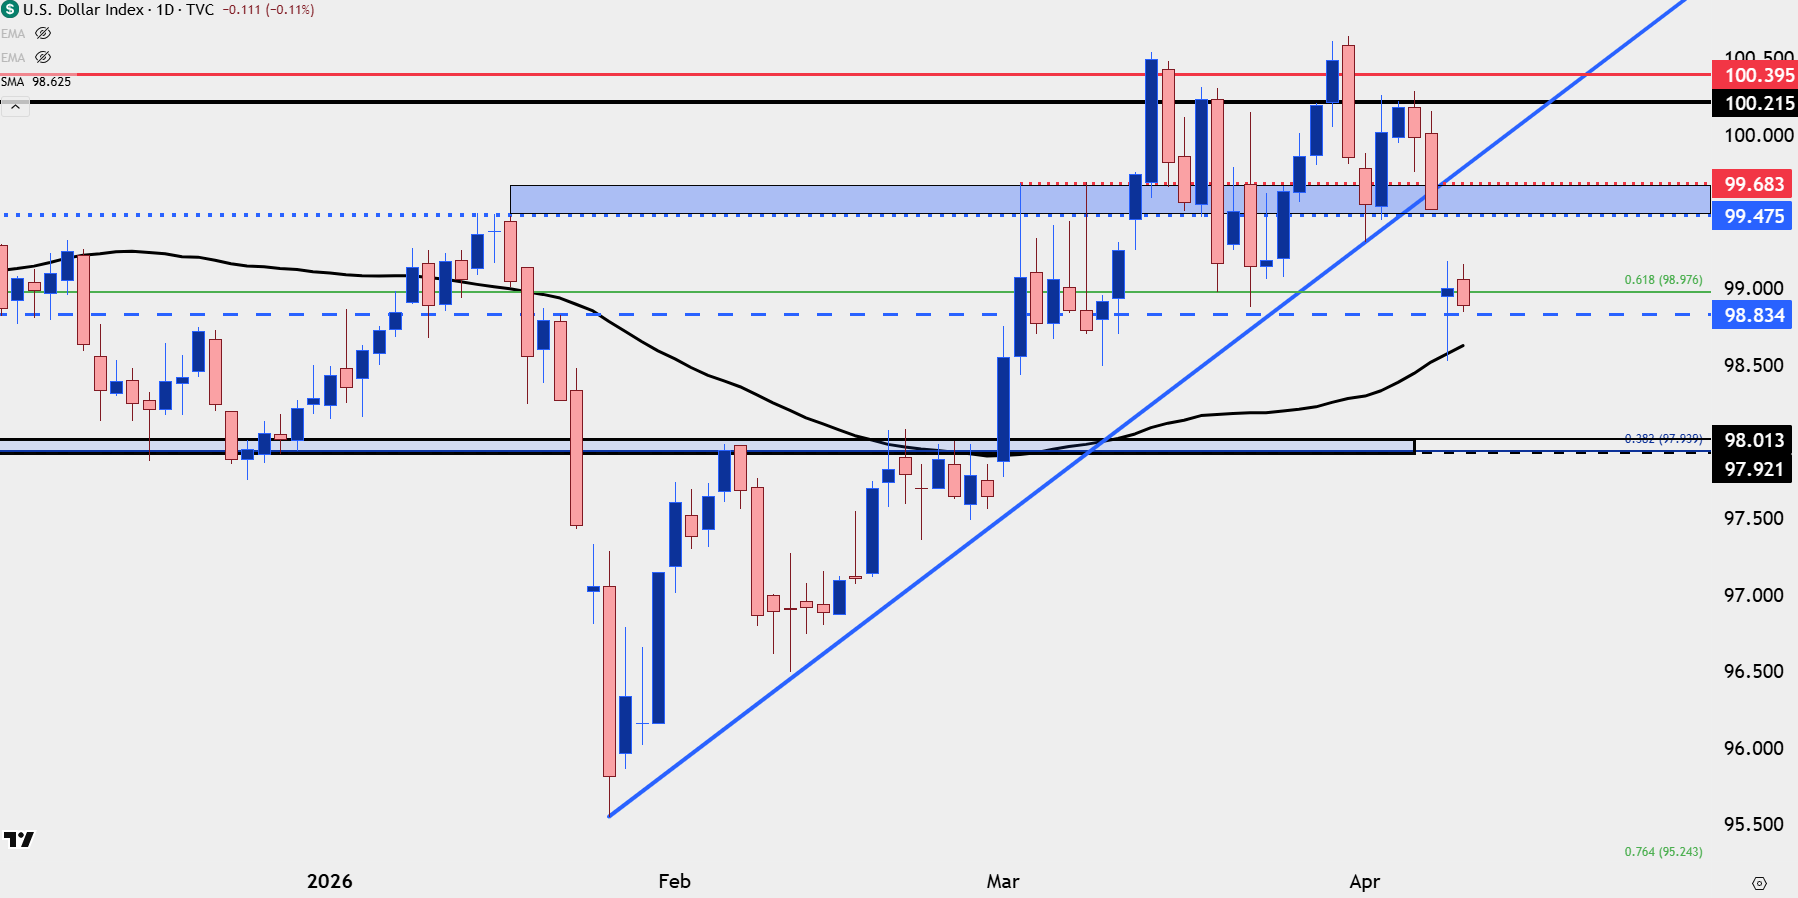
Chart prepared by James Stanley; data derived from Tradingview
EUR/USD
For USD-weakness, EUR/USD remains an attractive venue. Price has pulled back and tested support looked at in yesterday’s video and that was prior resistance for the past month, spanning from 1.1628-1.1655. So far, it’s the top of that zone that’s held the lows to bring bulls back in the matter, and price has already pushed back above the 200-day moving average.
EUR/USD Four-Hour Price Chart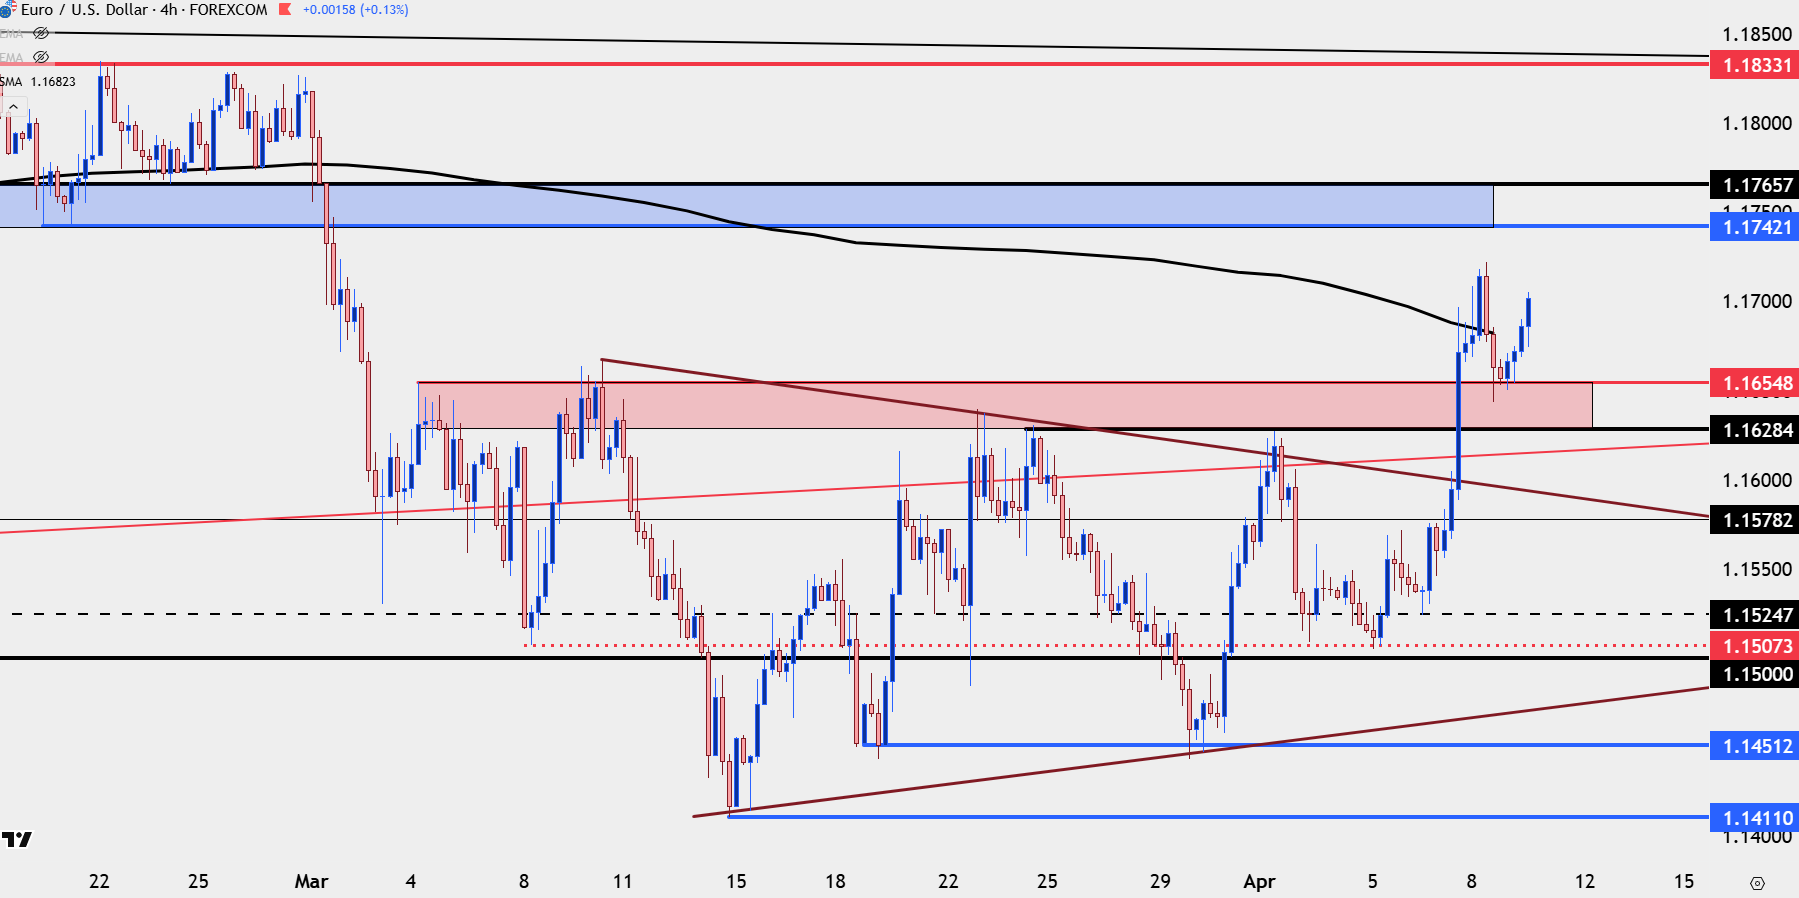
Chart prepared by James Stanley; data derived from Tradingview
GBP/USD
I have GBP/USD similarly aligned for USD-weakness setups. The pair jumped out of a falling wedge formation on Tuesday ahead of the ceasefire announcement and as we saw USD-weakness price in on the back of the actual announcement, Cable ran cleanly until stalling at resistance just below the 1.3500 handle.
If we do see the deeper pullback in the USD, with DXY going up to re-test that prior support zone as fresh lower-high resistance, Cable can be attractive for pullbacks with the 1.3250-1.3283 support zone.
GBP/USD Daily Chart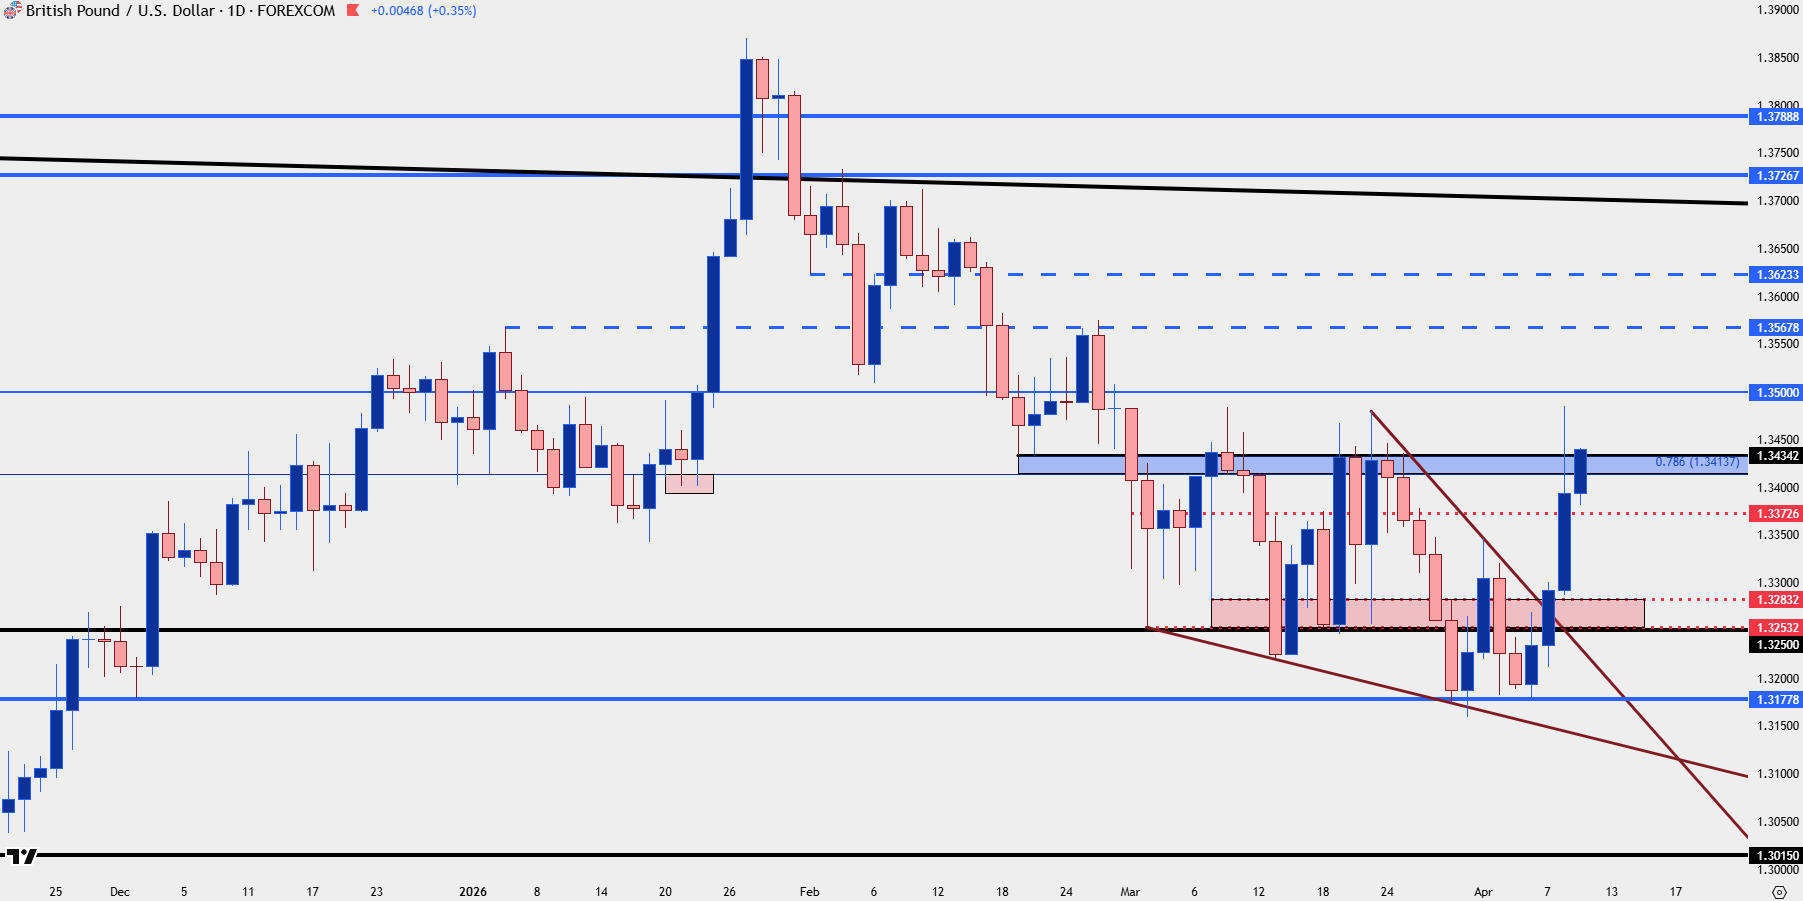
Chart prepared by James Stanley; data derived from Tradingview
USD/JPY: The Fallout Scenario
If we do see risk sell-off more aggressively into the weekend, driven by fears that not only is the ceasefire not going to work but that tensions may actually heat up, we can fast seen USD-strength back into the mix in a bigger way. And in that setup, it’s the 160.00 level in USD/JPY that could present a significant line-in-the-sand as the Bank of Japan might not find it so simple to intervene to defend the spot rate. Instead, they may simply draw the line in the sand a bit higher, similar to how they handled the 2022 scenario at 145 and then 150, and if that happens, then DXY breakouts could take over FX markets.
That’s not currently my base case, but it’s a scenario that must be entertained and at this point, even with USD weakness showing more significantly in areas like EUR/USD or GBP/USD above, USD/JPY has seen buyers holding key supports, and until the 151.95 level is traded through, buyers have a shot here.
USD/JPY Daily Price Chart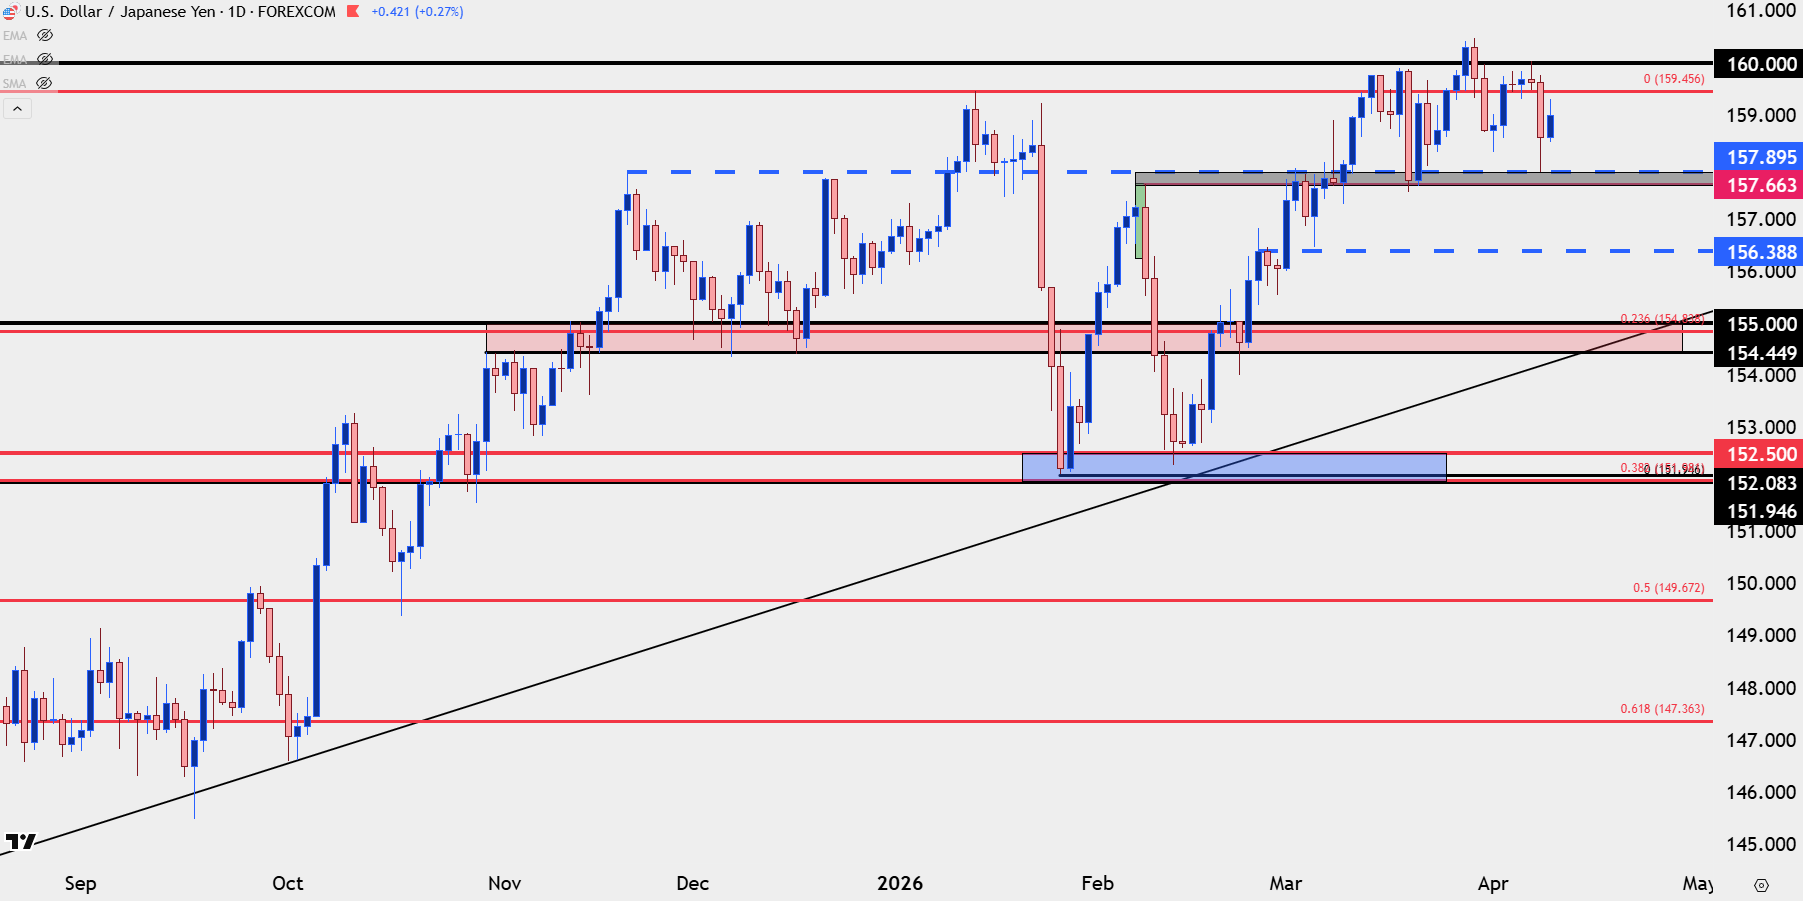
Chart prepared by James Stanley; data derived from Tradingview
--- written by James Stanley, Senior Market Analyst, Global Macro
Latest market news




Open an account in minutes
Experience award-winning platforms with fast and secure execution.
Economic calendar
Web Trader platform
Our sophisticated web-based platform is packed with features.
Related articles
US Dollar Price Action Setups: EUR/USD, USD/JPY, GBP/USD, USD/CAD
In a wide ranging webinar multiple USD pairs were in focus, continuing last week’s rally in DXY as EUR/USD tests 1.1000 and USD/JPY tests the 160.00 level.
EUR/USD outlook: euro back above 1.1000 as dollar rally loses steam
EUR/USD has recovered back above 1.1000 after a brief break lower, a sign the dollar's inflation-driven rally may be losing momentum. With a December Fed hike largely priced in and oil a potential tailwind for the euro, the risks are starting to tilt to the upside.

British Pound Technical Outlook: GBP/USD Tests Pivotal Support—Breakdown Risk Rises 11 17 2026
Sterling bears are pressing critical support near the yearly lows, with the next reaction likely to determine whether the broader trading range survives.

The information on this web site is not targeted at the general public of any particular country. It is not intended for distribution to residents in any country where such distribution or use would contravene any local law or regulatory requirement. The information and opinions in this report are for general information use only and are not intended as an offer or solicitation with respect to the purchase or sale of any currency or CFD contract. All opinions and information contained in this report are subject to change without notice. This report has been prepared without regard to the specific investment objectives, financial situation and needs of any particular recipient. Any references to historical price movements or levels is informational based on our analysis and we do not represent or warranty that any such movements or levels are likely to reoccur in the future. While the information contained herein was obtained from sources believed to be reliable, author does not guarantee its accuracy or completeness, nor does author assume any liability for any direct, indirect or consequential loss that may result from the reliance by any person upon any such information or opinions.
Futures, Options on Futures, Foreign Exchange and other leveraged products involves significant risk of loss and is not suitable for all investors. Losses can exceed your deposits. Increasing leverage increases risk. Spot Gold and Silver contracts are not subject to regulation under the U.S. Commodity Exchange Act. Contracts for Difference (CFDs) are not available for US residents. Before deciding to trade forex, commodity futures, or digital assets, you should carefully consider your financial objectives, level of experience and risk appetite. Any opinions, news, research, analyses, prices or other information contained herein is intended as general information about the subject matter covered and is provided with the understanding that we do not provide any investment, legal, or tax advice. You should consult with appropriate counsel or other advisors on all investment, legal, or tax matters. References to FOREX.com or GAIN Capital refer to StoneX Group Inc. and its subsidiaries. Please read Characteristics and Risks of Standardized Options.