




S&P 500 forecast: Forward testing the S&P 500 around Thanksgiving
I have always had an inkling that US equity markets tend to perform well heading into Thanksgiving. So today, I put that theory to the test.
Share this:

Takeaways
- A positive expectancy for the S&P 500 is apparent in the days leading into Thanksgiving
- There is also a tendency for the S&P 500 to weaken on the Monday following Thanksgiving, before rising on the Tuesday
- Whilst this data does not provide a solid roadmap for likely price direction, it does provide statistical comfort of a directional bias ahead and following Thanksgiving
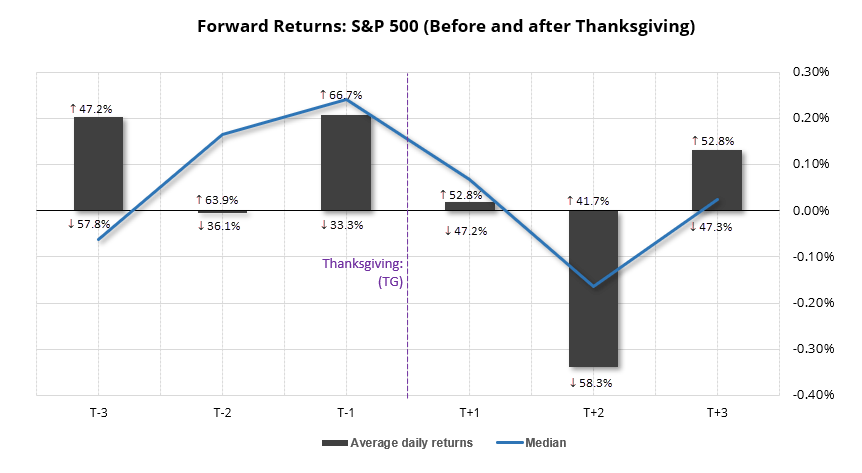
Using daily data since 1987, I have looked at how the S&P 500 performs in the three days prior and beyond US Thanksgiving. As markets are closed on Thanksgiving, it means we’re looking at the three days up to the close on Thanksgiving eve, and the three following Thanksgiving when the markets are open.
S&P 500 average daily returns around Thanksgiving
T-1 is the day prior to Thanksgiving (or ‘Thanksgiving eve’, if there I such a thing), whereas T+3 is the third business day following Thanksgiving. Each bar represents one day, of the average return for each period.
S&P 500 analysis: Heading into Thanksgiving
Whilst there is a positive average return ahead of Thanksgiving (TG) on T-3 and T-1, we actually see a slight negative average return on T-2. As TG in on Thursday this year, it could suggest that Monday and Wednesday provide better odds of up days then Tuesday.
However, T-3 only has a 47.2% average positive return over the sample, whilst T-1 has the highest average return alongside a 66.7% win rate. Perhaps Wednesday may stand the best chance of an up day this year. And the fact that T-2 has a negative average return with a 64% win rate, it suggests the down days have been considerably larger than the up days over the sample. And that is why the median return is positive for T-2 and the highest for T-1.
S&P 500 analysis: After Thanksgiving
The day following TG (T+1) seems like a coin flip with a minor average positive turn and only a slight increase of up days relative to down. And as many traders take an extra day of vacation on the Friday to achieve a nice 4-day weekend, perhaps this makes sense. It is therefore interesting to note that T+2 (the following Monday) has a clear bearish bias with average return of -0.34% with a down-day rate of nearly 60%. It seems whatever optimism traders expressed heading into the long weekend is truly over when they return to their desks on the Monday.
A smoother way of looking at the data is to use a rate of change between the respective day and TG. And looking at the data this way better shows that my inking was on the right track; traders prefer to buy the S&P 500 heading into S&P 500. It also shows a desire to sell the S&P 500 thereafter. So how does this stack up against current price action?
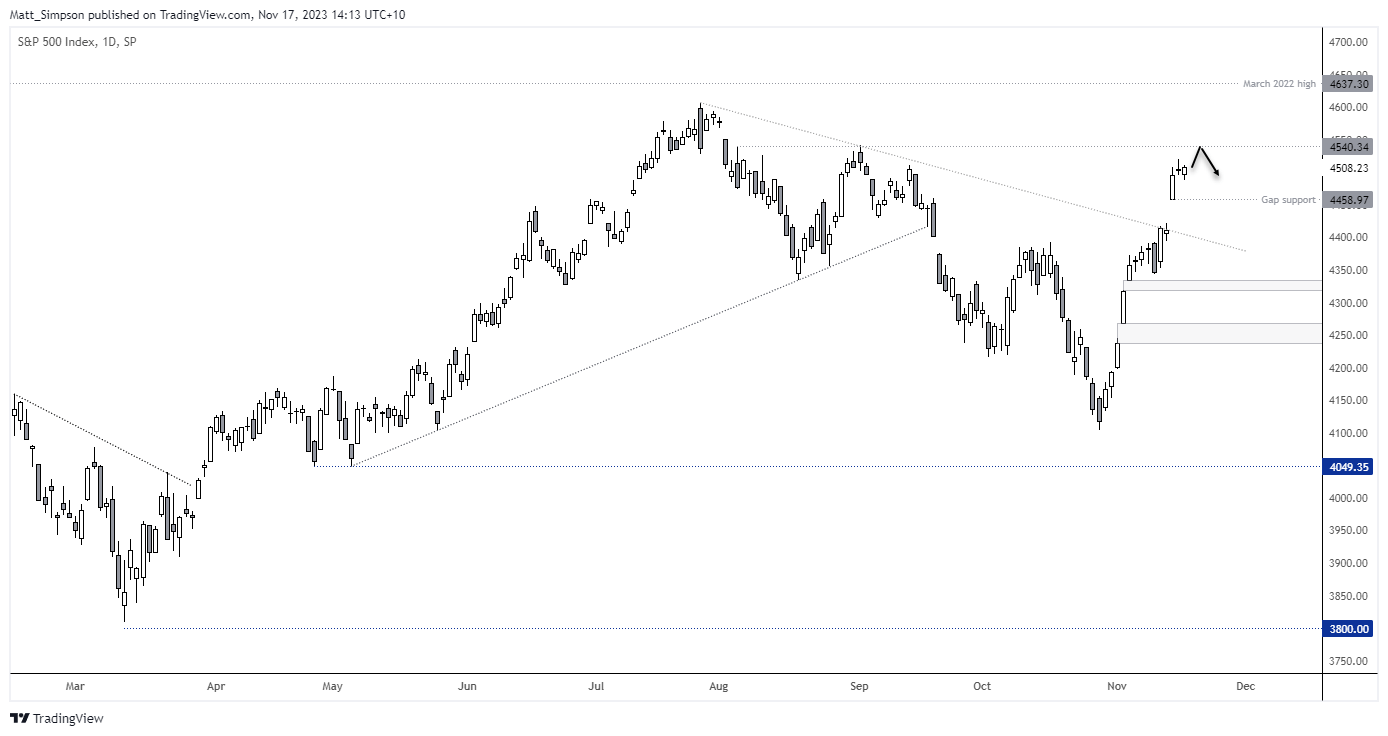
S&P 500 daily chart:
The main issue I have with simply assuming a rally ahead of Thanksgiving next week is that we have already seen an extended run, and it is near resistance around 4540. The daily chart shows volatility has subsided over the past two days after its 10% rally into Wednesday’s high. But perhaps we’ll be treated to a pullback during the final session of this week later today. In which case, bulls could seek intraday bullish setup on Monday, Tuesday or Wednesday next week if price action respects intraday support levels.
Of course, as these stats are backwards looking and simply show average returns which smooth over the data set and ignore individual stories behind a move on a given day, this data should not be used as a roadmap. But it does at least provide some statistical comfort that the odds favour a rally into Thanksgiving and a slight selloff thereafter, assuming no large macro theme arrives to dominate sentiment.
-- Written by Matt Simpson
Follow Matt on Twitter @cLeverEdge
How to trade with City Index
You can trade with City Index by following these four easy steps:
- Open an account, or log in if you’re already a customer
• Open an account in the UK
• Open an account in Australia
• Open an account in Singapore
- Search for the market you want to trade in our award-winning platform
- Choose your position and size, and your stop and limit levels
- Place the trade
Related tags:
Latest market news




Open an account in minutes
Experience award-winning platforms with fast and secure execution.
Economic calendar
Web Trader platform
Our sophisticated web-based platform is packed with features.
Related articles
USD/JPY, USD/CAD Outlook: Fed hawks put dollar bulls on alert
Hotter US inflation and hawkish Fed commentary have triggered a sharp repricing of interest rate expectations. USD/JPY and USD/CAD are in focus as the dollar's sensitivity to Fed policy strengthens.
Gold Feels the Weight of USD, Yields on Hawkish Fed and CPI
Gold remains under pressure as hot US CPI, rising Treasury yields and hawkish Fed commentary support the US dollar. Bears eye another break below $4,000

Bitcoin forecast: five weeks of selling put $65,000 back in focus
Bitcoin has fallen for five straight weeks, and a hotter October CPI report has added to the pressure. Record ETF outflows, forced liquidations and rising rate-hike bets leave $65,000 back in focus.

The information on this web site is not targeted at the general public of any particular country. It is not intended for distribution to residents in any country where such distribution or use would contravene any local law or regulatory requirement. The information and opinions in this report are for general information use only and are not intended as an offer or solicitation with respect to the purchase or sale of any currency or CFD contract. All opinions and information contained in this report are subject to change without notice. This report has been prepared without regard to the specific investment objectives, financial situation and needs of any particular recipient. Any references to historical price movements or levels is informational based on our analysis and we do not represent or warranty that any such movements or levels are likely to reoccur in the future. While the information contained herein was obtained from sources believed to be reliable, author does not guarantee its accuracy or completeness, nor does author assume any liability for any direct, indirect or consequential loss that may result from the reliance by any person upon any such information or opinions.
Futures, Options on Futures, Foreign Exchange and other leveraged products involves significant risk of loss and is not suitable for all investors. Losses can exceed your deposits. Increasing leverage increases risk. Spot Gold and Silver contracts are not subject to regulation under the U.S. Commodity Exchange Act. Contracts for Difference (CFDs) are not available for US residents. Before deciding to trade forex, commodity futures, or digital assets, you should carefully consider your financial objectives, level of experience and risk appetite. Any opinions, news, research, analyses, prices or other information contained herein is intended as general information about the subject matter covered and is provided with the understanding that we do not provide any investment, legal, or tax advice. You should consult with appropriate counsel or other advisors on all investment, legal, or tax matters. References to FOREX.com or GAIN Capital refer to StoneX Group Inc. and its subsidiaries. Please read Characteristics and Risks of Standardized Options.