GBP/USD off session lows after GDP data
• UK GDP MoM Nov -2.6% beating expectations of -5.7% YoY -8.9% vs -12.1%.• UK vaccine programmme to accelerate to 500,000 jabs a day
• USD clawing backs losses from previous session after Joe Biden introduced $1.9 trillion relief package but hinted at tax rises• Fed Powell said now was not the time to consider the Fed’s exit from an accommodative stance.
• US retail sales up next
GBP/USD technical analysis
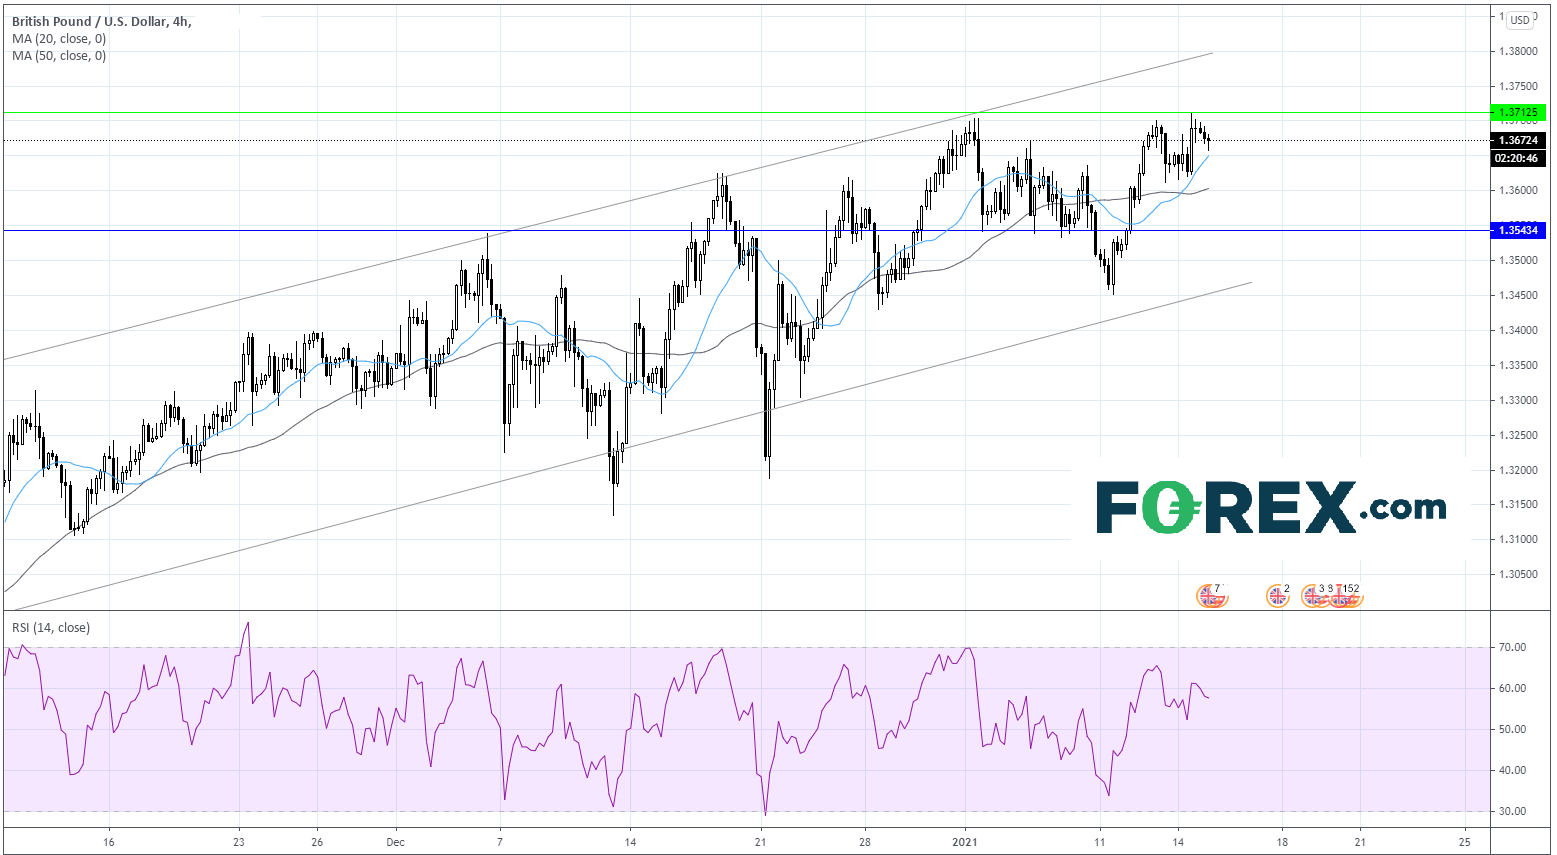
GBP/USD trades range bound between 1.3650 – 1.37.
GBP/USD continues to trade above its 20 & 50 sma on the 4 hour chart and remains firmly within the ascending channel indicating an establish bullish trend, however it has not shown strong signs of a break above 1.37. Renewed momentum is needed to retest this key level.
The RSI is over 50 but below 70 but points lower so a near term pullback could be on the cards.
A positive tone remains for the pair above 1.36. A break below here could see horizontal support at 1.3540 come into play.
On the upside a break above 1.37 could open the door to resistance at 1.3730 before 1.3760.
Learn more about trading forex.
WTI pulls back after retesting $54
WTI is coming under pressure in early trade as rising covid cases in China overshadowed strong crude import data from the world’s biggest crude imported.
Crude imports into China +7.3% in 2020.
Vaccine rollouts, rising sentiment and huge US stimulus optimism have been lifting oil over recent sessions. However China wrestling with fresh covid outbreaks has dragged on oil prices in the Asian session.
WTI technical analysis
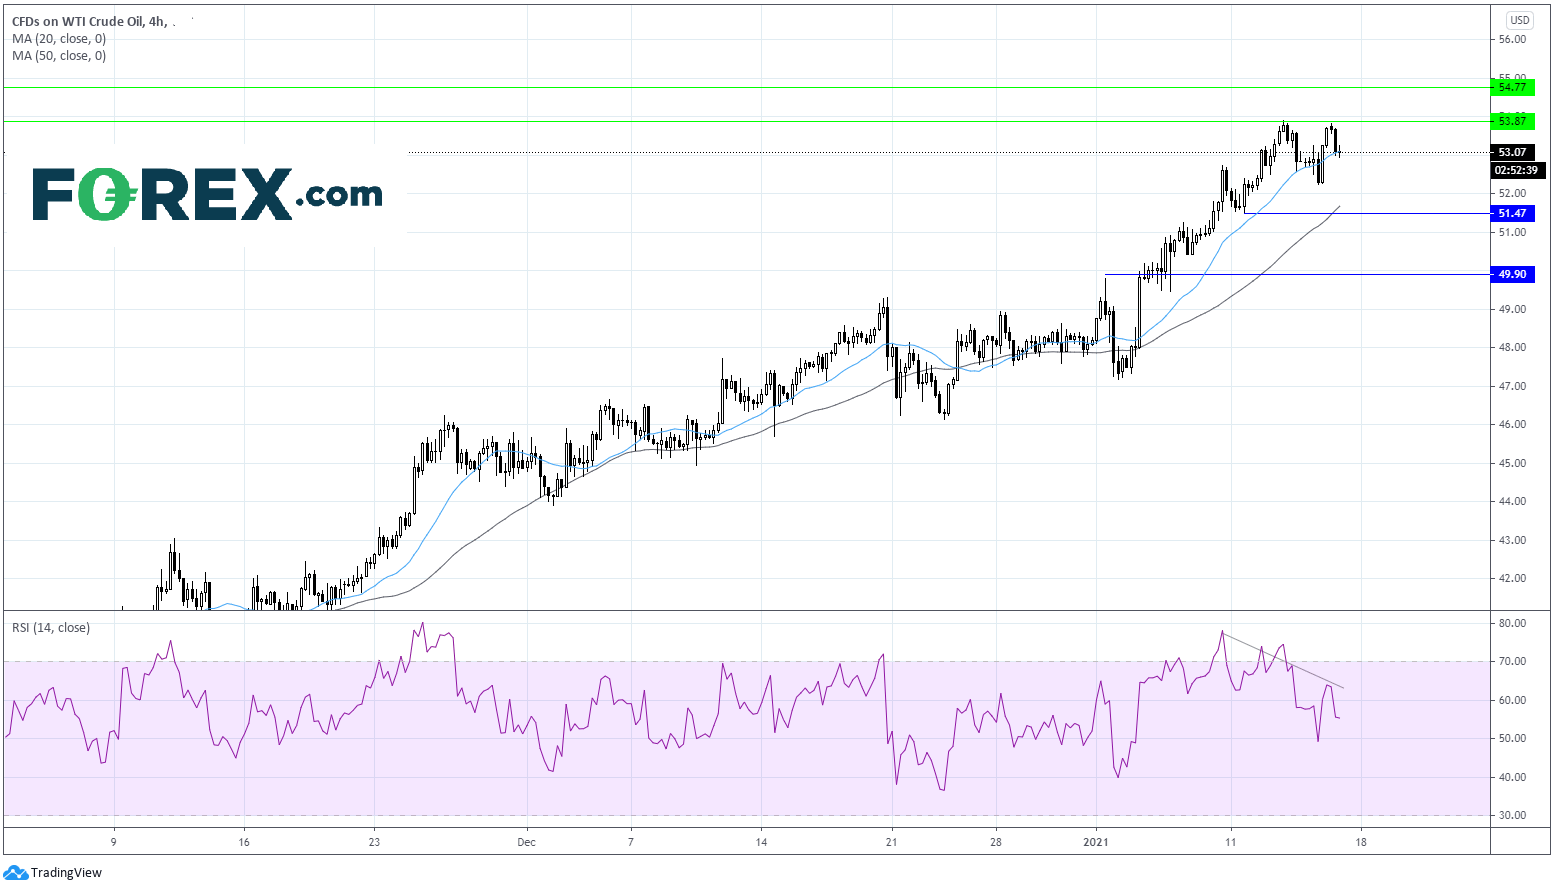
WTI has seen a solid run up over the past few month, but failed to break over $54 at the start of the week, turning lower to $52.24 on Tuesday, before rebounding to make another attempt on $54 overnight.
Another rejection of this level is signaling uptrend exhaustion, at least for now profit taking and technical selling is being seen.
On the 4 hour chart WTI trades over its 50 sma and the 20 sma is being tested at $53.
The RSI shows a bearish divergence which favours a pull back in the price for now.
Even so, the overall trend is bullish with key resistance at $54 prior to $54.66 (2020 high). A break below $50 is needed to negate the current uptrend.